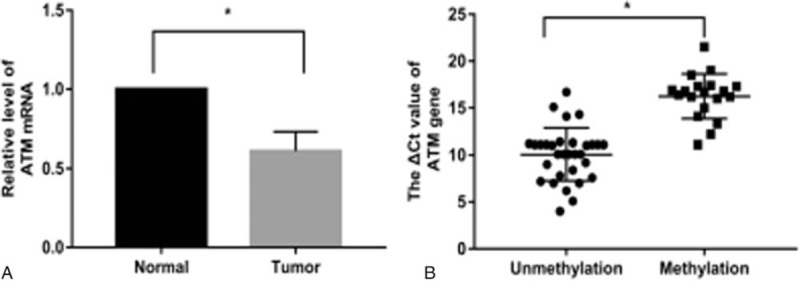
Figure 2.

Expression of ATM determined by qPCR. A: Expression levels of ATM mRNA in HCC and adjacent normal liver tissues (n = 50). ATM expression level was significantly lower in HCC tissues than in adjacent liver tissues. B: Expression levels of ATM mRNA in the methylated group (n = 19) and unmethylated group (n = 31). The ATM expression level was significantly lower in the methylated group compared with the unmethylated group.
