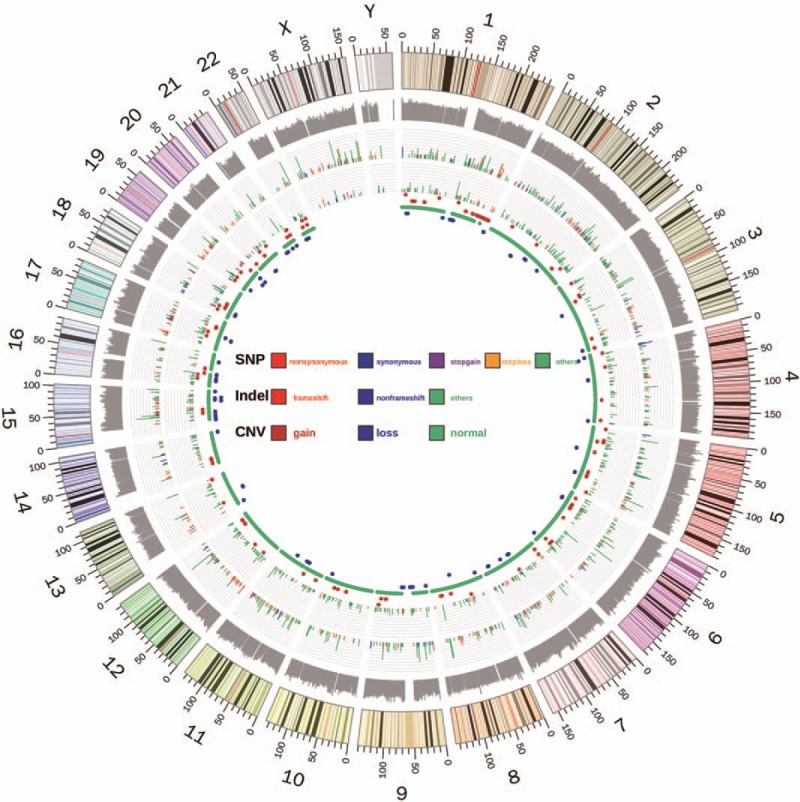
Figure 2.

Circos scheme shows the whole-exome sequencing landscape of somatic SNV, Indel and CNV distribution of the tumor tissue in this study in 24 chromosomes. From outer to inner rings: the outermost ring shows the human genome scheme including 24 chromosomes, followed by log10 values of coverage depth in WES. The types and position of SNV and INDEL mutations are presented consecutively. The length of lines represents the variant allele frequency and the colors represent types of mutations. The innermost ring represents the CNV change, in which red dots stand for amplification and blue dots stand for deletion, while green stands for normal CNV.
