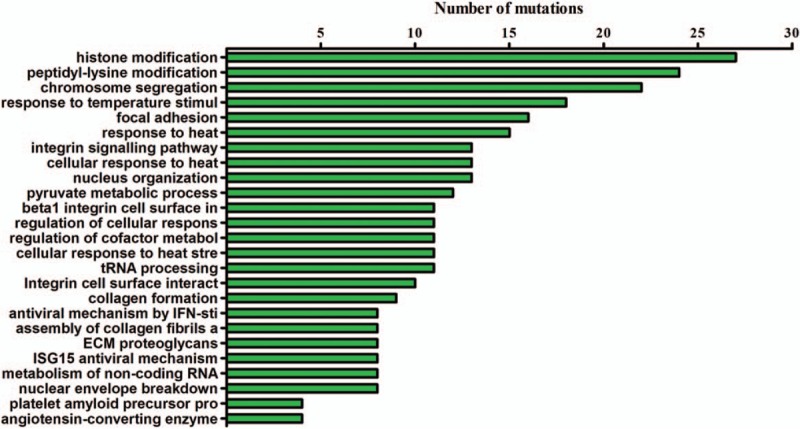
Figure 4.

The results of the pathway enrichment analysis on the tumor tissue of this case. Analysis methods included GO term enrichment analysis and KEGG pathway enrichment analysis of mutated somatic genes. X axis indicates the numbers of mutations detected for each function or pathway.
