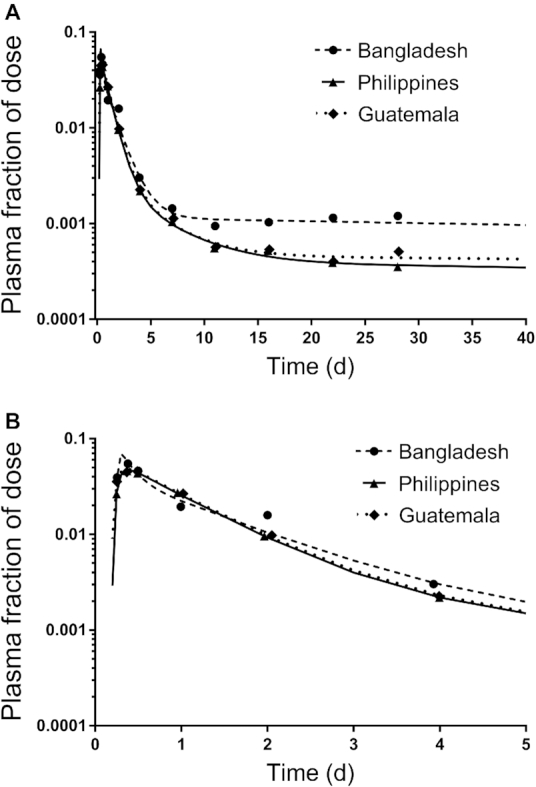
FIGURE 2.

Geometric mean observed and model-predicted fraction of dose for [13C10]retinol in plasma simulated to 40 d (A) or 5 d (B) for Bangladeshi, Guatemalan, and Filipino children. Symbols are observed data and lines are model simulations. For the Bangladeshi group, the super-child data set included 5–6 children/time except at 4 d when there were 40 children; for the Filipino group, there were 9–13 children/time and 112 at 4 d; the Guatemalan group included 8–16 children/time and 135 at 4 d. Mean data for each group were fit independently using the model shown in Figure 1. The model-calculated weighted sums of squares for plasma were 6.2E-07, 1.9E-08, and 5.6E-08 for the Bangladeshi, Filipino, and Guatemalan groups, respectively.
