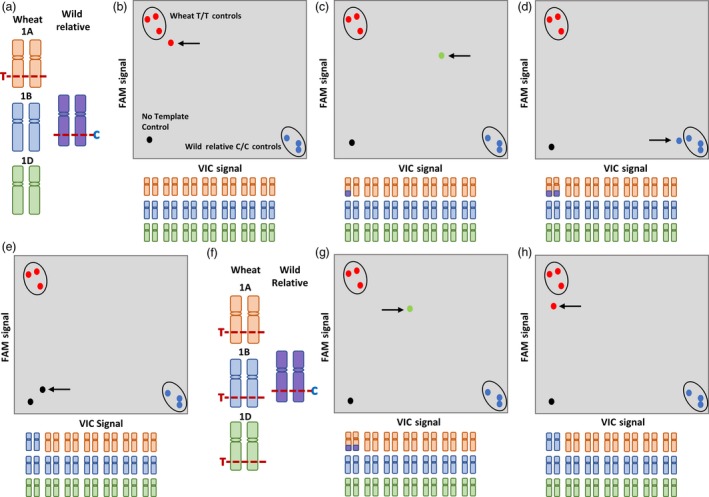
Figure 2.

Illustration of genotyping when using chromosome‐specific and chromosome‐nonspecific KASP assays. (a) A chromosome‐specific SNP T/C, on wheat chromosome 1A, used for KASP assay design and genotyping of (b) a line with no wild relative introgression shows a homozygous wheat call (red circle indicated by arrow), (c) a line with a heterozygous introgression shows a heterozygous call (green circle indicated by an arrow), (d) a line with a homozygous introgression shows a homozygous wild relative call (blue circle indicated by an arrow), and (e) a nullisomic–tetrasomic N1AT1D line shows a no call (black circle indicated by an arrow). (f) A chromosome‐nonspecific SNP T/C, having homoeologous copies on wheat chromosomes 1A, 1B and 1D, used for KASP assay design and genotyping of (g) a line with a homozygous introgression shows a heterozygous call (green circle indicated by an arrow), and (h) a nullisomic N1AT1D line shows a homozygous wheat call (red circle indicated by an arrow). In all scenarios, the wheat positive controls are genotyped as T/T (red circles), the wild relative positive controls are genotyped as C/C (blue circles), and the no template control is genotyped as no call (black circle).
