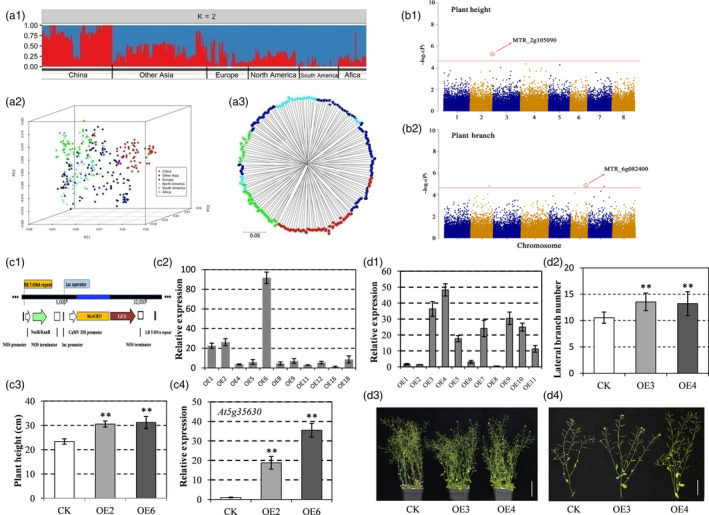
Figure 1.

(a) Structure (a1), principal coordinate analysis (a2) and NJ tree (a3) of the alfalfa association panel using the marker data generated by GBS. (b) Manhattan plot showing significant alfalfa locus associated with plant height (b1), and plant branching (b2). Negative log10 (P) values from a genome‐wide scan are plotted against position on each of eight chromosomes. (c) Functional characterization of MsACR11 as an ACR‐domain protein in Arabidopsis thaliana. (c1) Schematic showing the transfer DNA of the vector. (c2) expression analysis of MSACR11 in A. thaliana overexpression lines by qRT‐PCR. Total RNA was extracted from 3‐week‐old A. thaliana transgenic lines. The data are shown as the means ± SD of three biological replicates. (c3) the plant height of WT and transgenic A. thaliana plants. (c4) the transcription level of AtGLN2 (At5g35630) in transgenic lines and WT plants (data are the means ± SD of three biological replicates). (d) Functional characterization of MsPB1 in A. thaliana. (d1) the expression analysis of MsPB1 in A. thaliana transgenic lines by qRT‐PCR. Total RNA was extracted from 3‐week‐old A. thaliana transgenic lines (data are the means ± SD of the biological replicates). (d2) the plant branch number of transgenic A. thaliana and WT plants (means ± SD, n = 6). (d3) phenotypes of plants of control (wild type col‐0) and transgenic lines. (d4) phenotypes of lateral branches in control and transgenic plants. CK, Control (Col‐0); OE, Overexpression. Bars = 5 cm in d3 and d4. ‘**’ in c3, c4 and d2 indicated P < 0.01.
