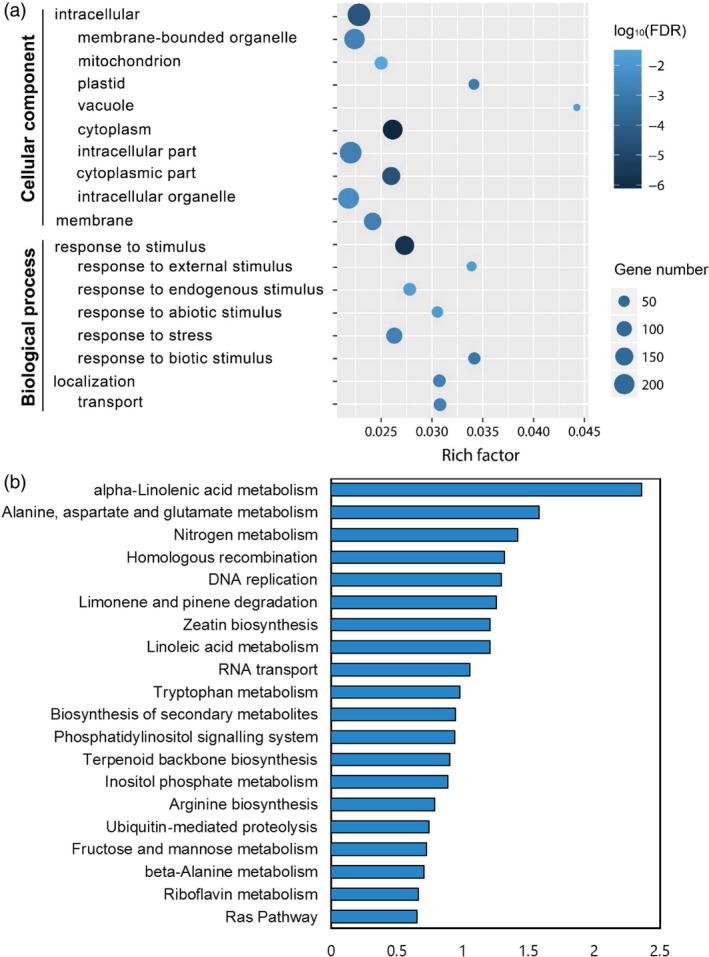
Figure 3.

GO enrichment and KEGG pathway analyses of cis targets of Xoo‐responsive lncRNAs. (a) GO terms of 512 annotated genes in the GO database were analysed, and ‘cellular component’ and ‘biological process’ ontologies were enriched. Richness factor was calculated by the number of genes mapped to the GO term, and the log10(FDR) value indicates the significance of the GO term. (b) KEGG pathway enrichment analysis of 704 genes. The top 20 enriched pathways are shown. The x‐axis is –log10(P value), that is significance of KEGG pathway enrichment.
