Figure 5.

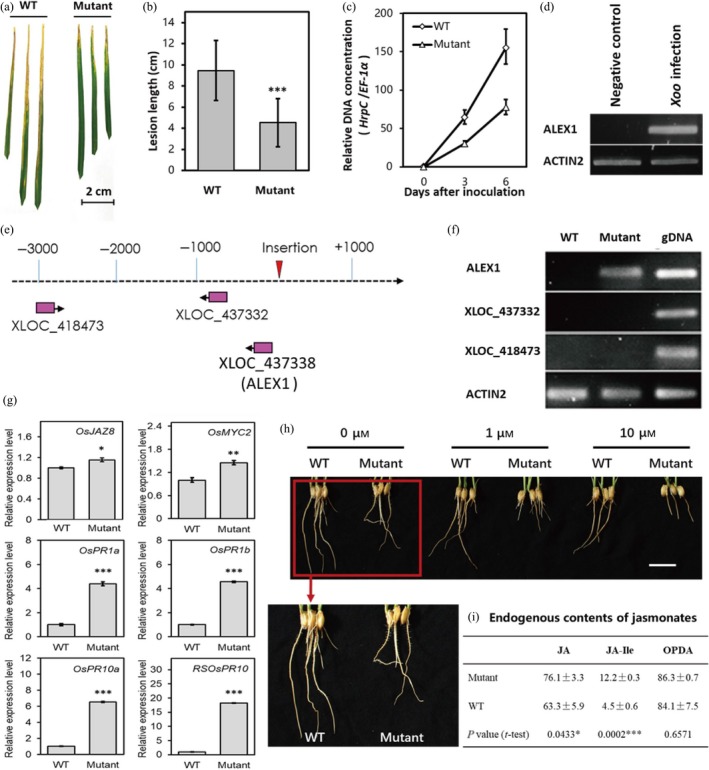
Phenotypic and molecular basis analysis of ALEX1 mutant. (a) Comparison of resistance to Xoo between wild type and ALEX1 mutant. (b) Lesion length of wild type and ALEX1 mutant after 14 days infected by PXO99A (n = 30). Asterisks indicate statistically significant differences compared with wild type by Student's t test (***P < 0.001). (c) Real‐time PCR analysis of relative DNA concentration between bacterial HrpC and rice EF‐1α in wild type and ALEX1 mutant. The data are expressed as the mean ± SD of three replicates. (d) The Xoo‐induced ALEX1 expression in rice leaves. (e) Model of enhancer trap insertion site and genes in the region 10 kb upstream or downstream of insertion site. (f) Expression levels of lncRNAs near the insertion site. Rice gene Actin 2 was used as an endogenous control. The rice genomic DNA was also amplified as positive controls. (g) Relative expression levels of output genes in JA signalling. Actin 2 was used as an endogenous control in quantitative real‐time PCR. The data are expressed as the mean ± SD of three replicates. Asterisks indicate statistically significant differences compared with wild type by Student's t test (*P < 0.05; **P < 0.01; ***P < 0.001). (h) Root development of ALEX1 mutant and WT plants under the treatment of a gradient of MeJA concentration. Scale bar = 2 cm. (i) Content of endogenous jasmonates in ALEX1 mutant and WT plants. The data are expressed as the mean ± SD of three replicates. Asterisks indicate statistically significant differences compared with wild type by Student's t test (*P < 0.05; ***P < 0.001).
