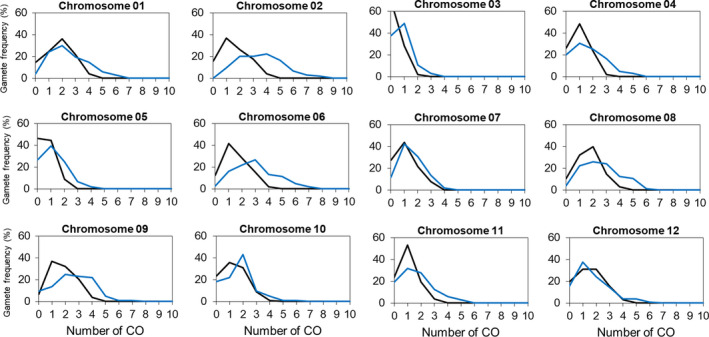
Figure 5.

Crossover frequency distribution in wild‐type F1 and recq4 F1 plants as measured by the transition of KASP marker genotypes from one marker position to the next, for each of the 12 chromosomes. Black lines: wild type. Blue lines: recq4 mutant.
