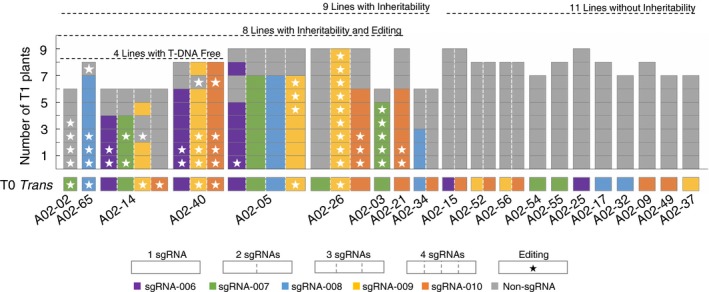
Figure 3.

sgRNA inheritance and mutant frequency in T0 and T1 progenies of sublibrary A02. Y‐axis indicates the number of examined T1 plants. Small blocks indicate examined plants. Purple (sgRNA‐006), green (sgRNA‐007), blue (sgRNA‐008), yellow (sgRNA‐009) and orange (sgRNA‐010) colours indicate the presence of represented sgRNA in the plant. Grey colour indicates the absence of sgRNA. Stars indicate the presence of gene editing in the target loci.
