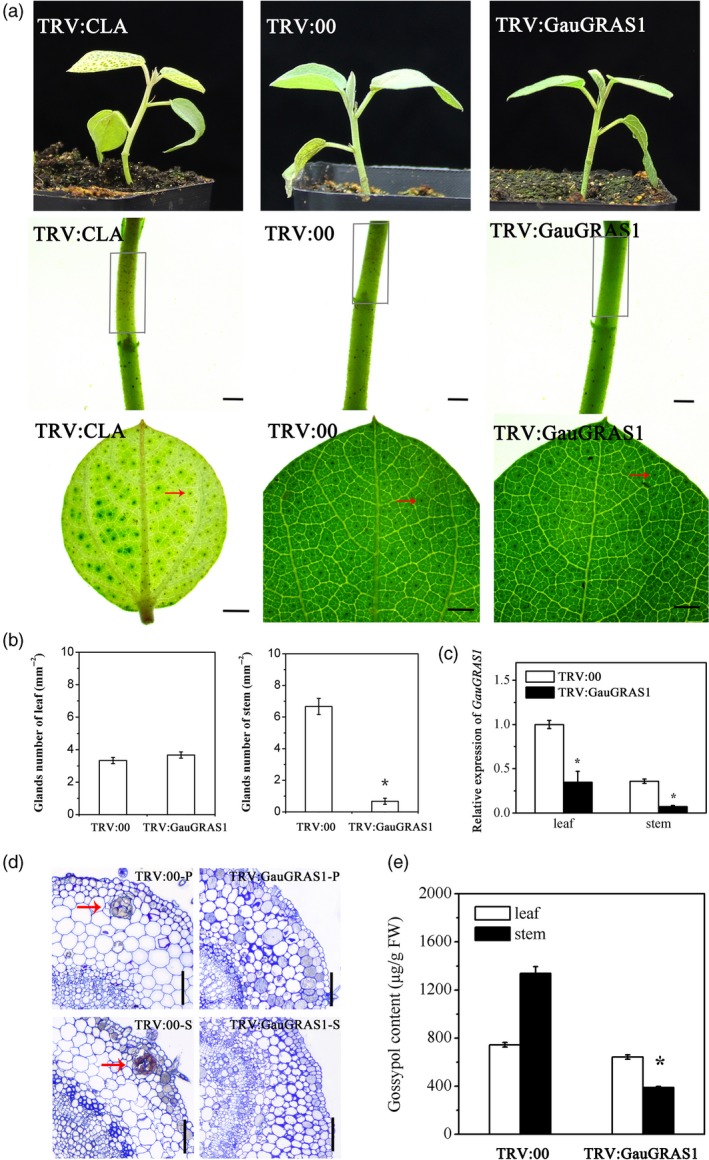
Figure 5.

Functional characterization of GauGRAS1 by VIGS. (a) Phenotypes of Gossypium australe after GauGRAS1 silencing by VIGS; TRV:CLA and TRV:00 are the positive control and negative control, respectively. The grey box indicates glands in the stem, and the red arrow indicates glands on the leaf. Scale bars, 1 mm. (b) Statistical chart of the number of glands in the leaves and stems. (c) The silencing efficiency of GauGRAS1. (d) A cavity was observed in the empty vector (TRV:00) leaves and stems but disappeared in the GauGRAS1‐silenced plants. P: petiole, S: stem. Scale bars, 100 μm. (e) Gossypol content in empty vector (TRV:00) and in the GauGRAS1‐silenced leaves of G. australe. Error bars are the SD of three biological repeats. *P < 0.05; Student's t test, n = 3.
