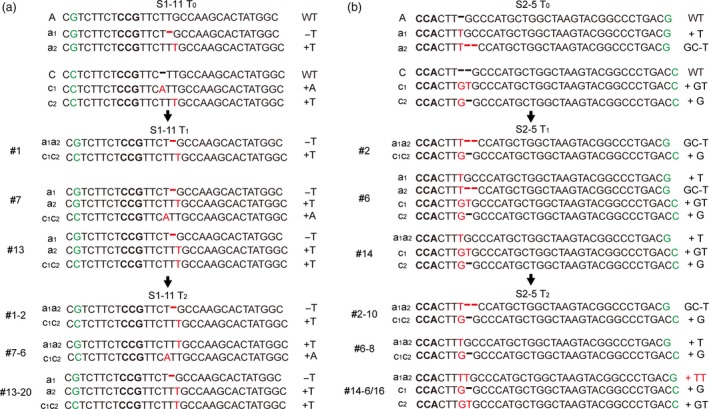
Figure 5.

The target site mutations at the T0, T1 and T2 generations in S1‐11 and S2‐5 lines. The green colours indicate the SNP between the two BnaMAX1 genomes, and the bold fonts indicate the PAMs. The red fonts and hyphens indicate insertions and deletions, respectively.
