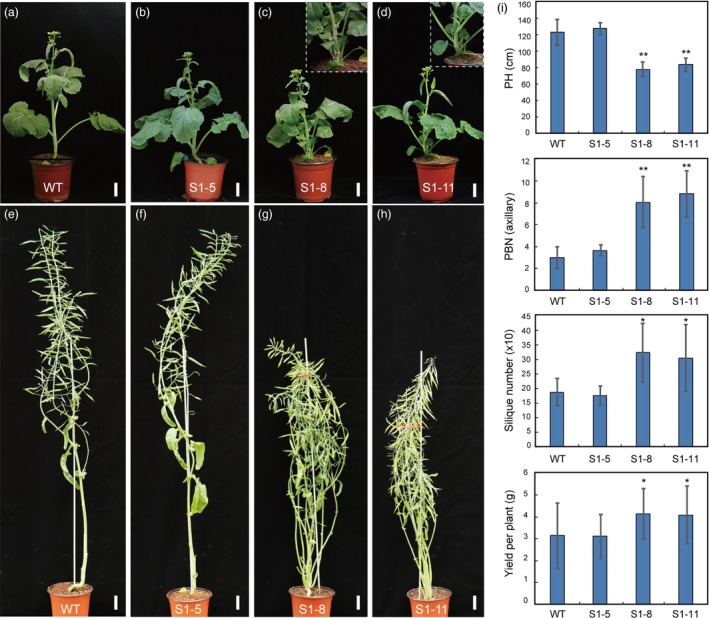
Figure 6.

Morphological comparison of wild‐type (WT) and BnaMAX1 homozygous mutant plants at various developmental stages. (a–d) The S1‐8‐39‐1 and S1‐11‐7‐3 homozygous plants show more axillary buds than WT and S1‐5‐6‐8 at the bolting stage. (e–h) The S1‐8‐39‐1 and S1‐11‐7‐3 homozygous plants show dwarfism and higher branch numbers than WT and S1‐5‐6‐8 at the mature stage. (i) Statistical analysis of plant height (PH), branching number (BN), silique number (SN), and yield per plant in WT, S1‐5‐6‐8, S1‐8‐39‐1 and S1‐11‐7‐3 homozygous plants in the greenhouse. Error bars ± standard deviation (n = 15 for PH, BN and yield; 10 for SN in WT, S1‐5‐6‐8, S1‐8‐39‐1 and S1‐11‐7‐3). Student's t‐test was used for statistical analysis (*P ≤ 0.05; **P ≤ 0.01). Bars = 5 cm.
