Figure 2.

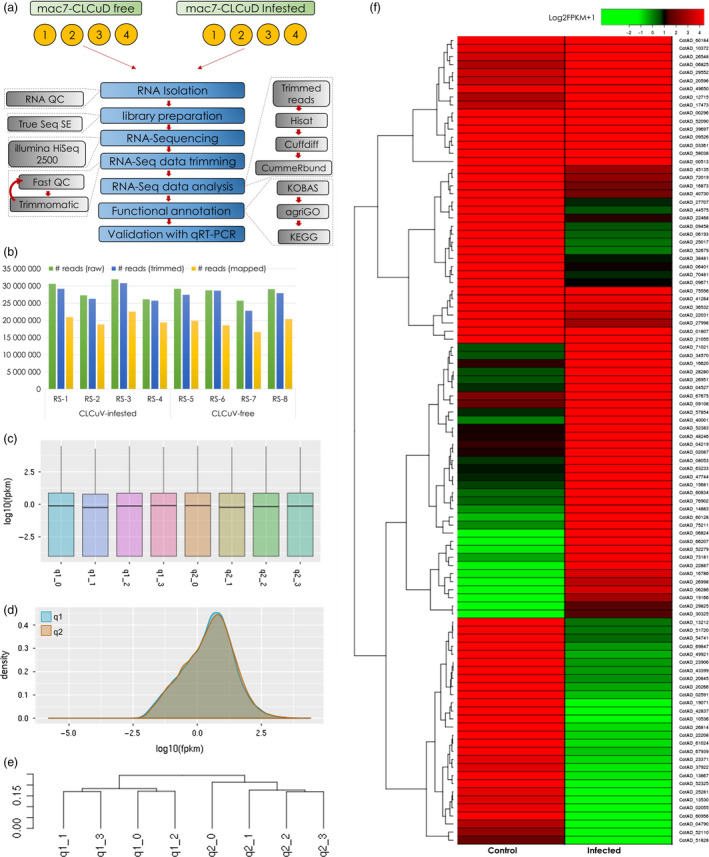
RNA‐Seq pipeline and transcriptomic data analysis. (a) Schematic representation of RNA‐Seq workflow for Mac7 with and without the infestation of cotton leaf curl disease (CLCuD). Four biological replicates were used in each treatment. (b) RNA‐Seq reads mapped/unmapped and mapping percentage for each sample. Panel (c) and (d) indicate the distribution of log10 of FPKM (fragments per kilobase of transcript per million mapped reads) in each sample where q1 represents Mac7 CLCuD free and q2 represents Mac7 under CLCuD infestation. Panel (e) represents the phylogenetic tree based on log10FPKMs of each sample. Clear distribution of q1 and q2 in separate clades indicate that biological replicates for each treatment are true representatives of each condition and assure the reproducibility of experiment. Panel (f) shows the heatmap of differentially expressed genes (DEGs) in RNA‐Seq data of Mac7 under CLCuD infestation (Column 2: infected) as compared to CLCuD‐free Mac7 (Column 1: Control). Log2FPKM + 1 value was used to construct heatmap as indicated on the colour key; heatmap2 package in R was used to construct heatmap.
