Figure 4.

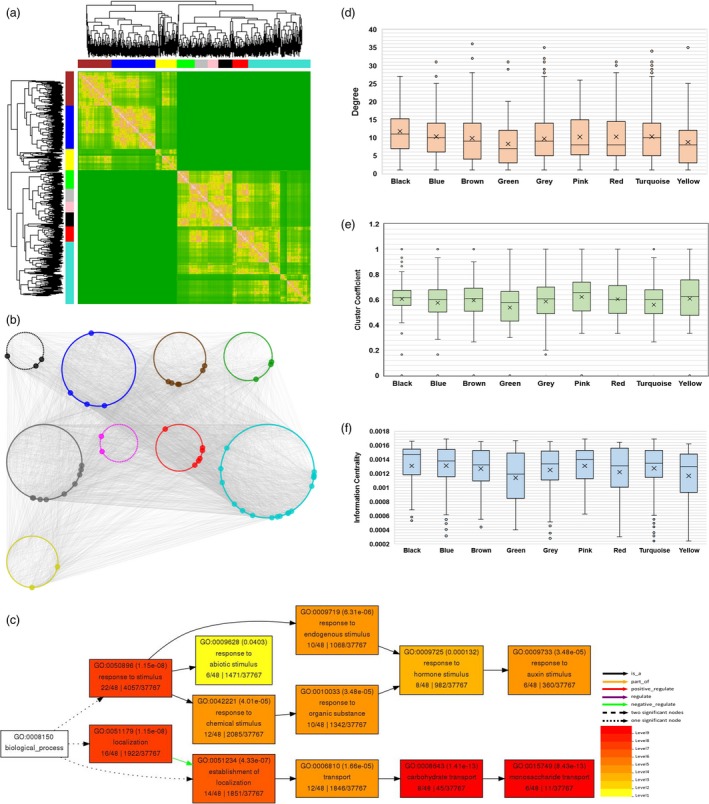
Weighted gene co‐expression network construction and co‐expressed network analysis for CLCuD‐responsive cotton genes in resistant genotype. (a) Resistant cotton genotype Mac7, under CLCuD infestation and CLCuD‐free conditions, was analysed by WGCNA using 1676 DEGs. Genes were clustered as per expression arrangements characterized by the dendrogram and topological overlap mapping metric (TOM) heatmap. Each line of the dendrogram corresponds to a gene. Clusters of similarly regulated genes are indicated as modules by a corresponding colour (black, blue, brown, green, grey, pink, red, turquoise and yellow) with a threshold minimum module size of 70 genes. The intensity of pink colouring in heatmap specifies high strength and green as no strength of correlation between pairs of genes on a direct scale and features hierarchical clustering dendrograms possessing a range of weighted correlations. (b) Weighted network illustrates correlations (edges) among the nodes (genes) with a weighted correlation threshold of ≥0.85. The network is composed of 7770 connections and 1564 genes organized in nine different modules. The node colour corresponds to modules identified via WGCNA. Nodes with high connectivity (≥25 connections, hubs) among different modules are indicated with increased node size. (c) Gene ontology analysis of gene IDs associated with highly correlated 52 hubs among 9 modules identified in WGCNA. GO analysis was performed using online tool agriGO. A key on the bottom right indicated the significance of GO terms and their association. (d) Highly connected nodes (hubs) within the co‐expression network are shown. Average degree of turquoise, blue and black modules are higher than the entire co‐expression network (9.936061381). (e) Clustering coefficient (degree to which a node is connected in a neighbourhood) for genes within each node in a box plot is illustrated. Turquoise, blue and black as well as two additional modules (pink and black) display significantly high average clustering coefficient than whole co‐expression network (0.580615941). (f) The information centrality (the flow of information between any two nodes in a connected network) for the largest component of co‐expression network (588 nodes) is presented. Turquoise, blue and black as well as pink modules display significantly increased information centrality compared to the entire network (0.00126154).
