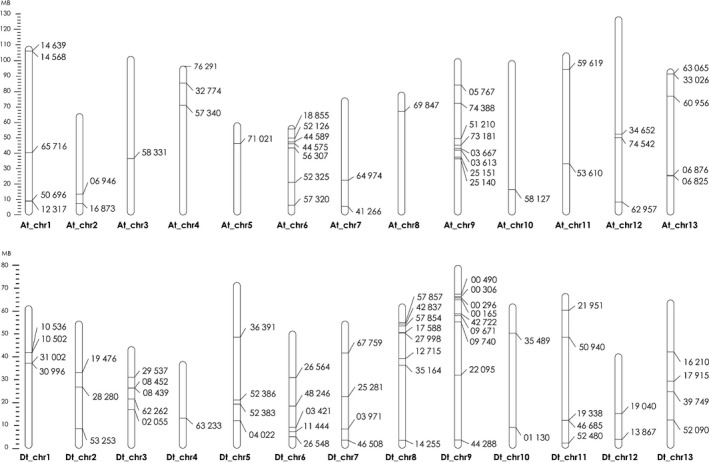
Figure 5.

Mapping of disease responsive genes in Mac7 on Gossypium hirsutum chromosomes. Chromosomes of subgenome A are indicated with At_ and D with Dt_. A ladder on the left indicates the length of chromosomes and distance between genes in mega bases (MB). Markings on each chromosome represent the respective CLCuD responsive genes in Mac7, and the corresponding numbers represent the gene IDs. The map indicates the clear even distribution of disease responsive genes among both subgenomes.
