
Figure 6.
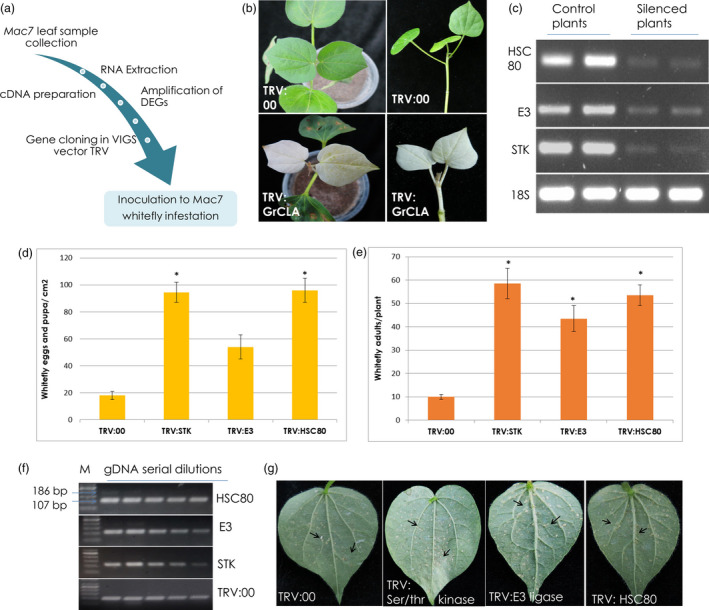
Validation of transcriptomic data by virus‐induced gene silencing of selected genes in Mac7. (a) General methodology adopted for virus‐induced gene silencing (VIGS). Ten‐day old young plantlets of Mac7 were used for agro‐inoculation of plants with VIGS vectors. (b) After 12 days postinoculation, TRV:00 plants showed no change in phenotype, while the bleaching phenotype was observed in TRV:GrCLA plants confirming the efficiency of VIGS system. (c) RT‐PCR showing the down‐regulation of respective genes in silenced plants compared to TRV:00 plants. (d) Quantification of whitefly eggs and pupa on Mac7 VIGS plants 2 weeks post‐whitefly infestation. Error bars represents standard error among biological replicates, and *shows significance using Student's t‐test. (e) Quantification of whitefly adults on Mac7 VIGS plants 2 weeks post‐whitefly infestation. Error bars represents standard error among biological replicates, and *shows significance using Student's t‐test. (f) Semi‐quantitative PCR shows a minute virus titre in plants silenced for STK, E3 ligase and HSC80. The lower band of 107 bp with higher intensity indicates the cotton endogenous gene Sad1, and the upper band is 186 bp showing virus presence, M: 50 bp DNA marker. (g) Representative images of Mac7 VIGS plants after 2 weeks of whitefly infestation, and black arrows represent whitely eggs and pupae.