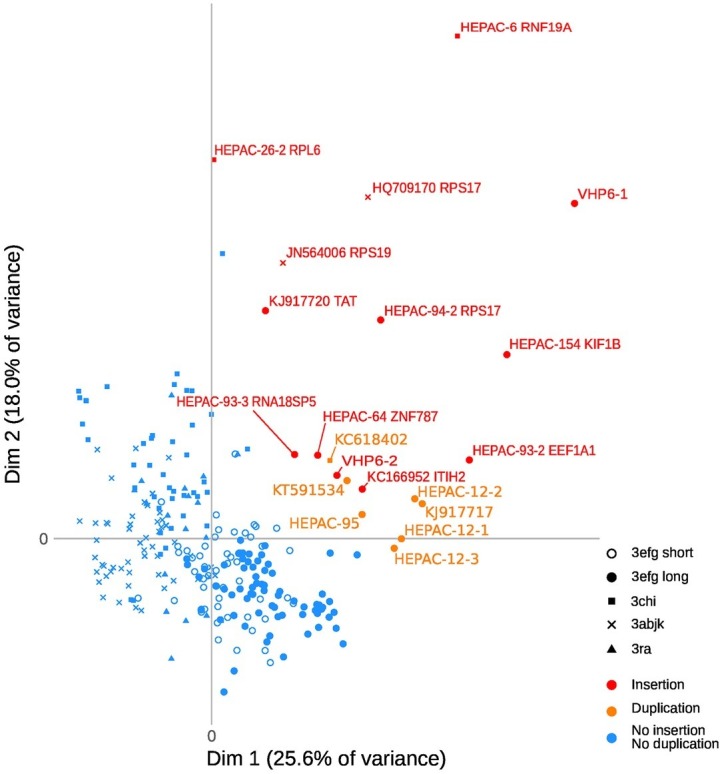
Figure 2.

Principal Component Analysis of HEV-3 PPR sequences with insertions or duplications. Individual observations, each dot represents a sample. Each clade (3 abjk, 3 chi, 3 efg short or long, and 3ra) is represented by a symbol. The axes show the first two principal components [dimension 1 (dim 1) and dim 2], with the fraction of explained variance in parenthesis. Variables of the two components are detailed in Figure 3.
