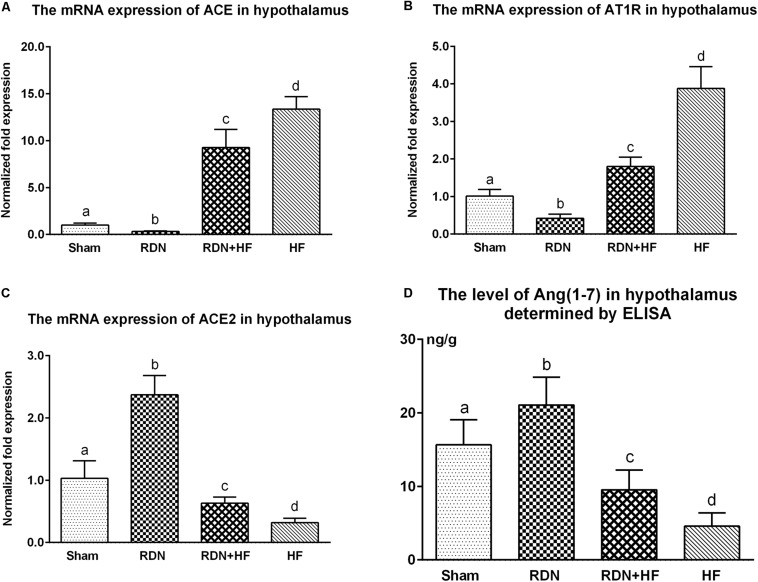
FIGURE 4.
The transcript levels of RAS components (ACE/ACE2/ATIR) in the hypothalamus determined by real-time RT-PCR (A–C) and concentration of Ang-(1-7) in the hypothalamus measured via ELISA (D). The different lowercase letters show significant differences of the variable among groups (p < 0.05), whereas the same lowercase letters show no statistical differences (p > 0.05). RAS, renin–angiotensin system; ACE, angiotensin-converting enzyme; AT1R, AngII type 1 receptor; Ang-(1-7), angiotensin-(1-7).

