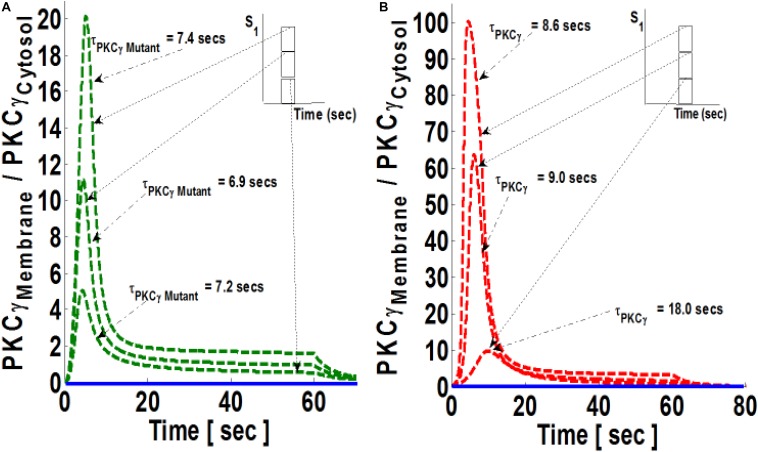
FIGURE 4.
The simulations mimicking the effect of stimulation strength on the comparative translocation kinetics of PKCγ isoform in the mutant and wild-type models of PCs. Here, the strength of stimulation is controlled by setting the pulse parameter “S1” at different levels. The parameter S1 is set at arbitrary values of 20, 40, and 60 (inset). The duration of pulse for all these three cases is 1 min. Here, the solid line represents the non-stimulation and the dashed line represents the stimulation condition (green dashed line, mutant; red dashed line, wild-type PCs). (A) Translocation characteristics of PKCγ in the mutant model. Here, results show that maximum levels of M/C ratio of PKCγ increases with increase in the strength of parameter “S1”; however, the residence time of mutant PKCγ first decreases and then increases with pulse strength (S1 = 20, leads to maximum M/C levels of 5 and τPKCγmutant = 7.2 s; S1 = 40, leads to maximum M/C levels of 11 and τPKCγmutant = 6.9 s; S1 = 60, leads to maximum M/C levels of 20 and τPKCγmutant = 7.4 s). (B) Translocation characteristics of PKCγ in the wild-type models. Here, results show that maximum levels of the M/C ratio of PKCγ increases with increase in the strength of parameter “S1,” and the residence time of wild-type PKCγ decreases with pulse strength (S1 = 20, leads to maximum M/C levels of 10 and τPKCγ = 18 s; S1 = 40, leads to maximum M/C levels of 64 and τPKCγ = 9 s; S1 = 60, leads to maximum M/C levels of 100 and τPKCγ = 8.6 s).

