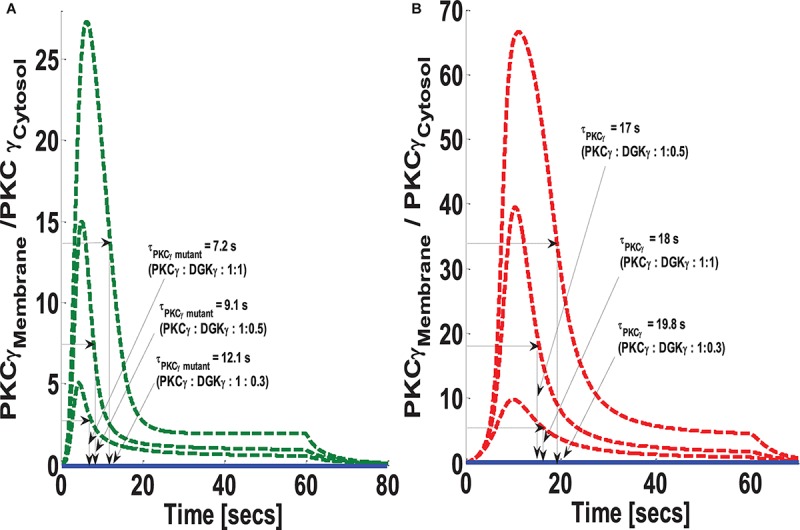
FIGURE 8.

The simulations mimicking the effect of PKCγ to DGKγ expression ratio on the comparative translocation kinetics of PKCγ molecule in the mutant and wild-type models of PCs. Three different levels of expression ratios are used (PKCγ:DGKγ: 1:1; PKCγ:DGKγ: 1:0.5; PKCγ:DGKγ: 1:0.3). Here, the strength of stimulation is controlled by setting the pulse parameter “S1” at 20. The duration of pulse is set for 1 min; the solid line represents the non-stimulation and the dashed line represents the stimulation condition (green dashed line, mutant; red dashed line, wild-type PCs). (A) Translocation characteristics of PKCγ in the mutant model. Here, results indicate that reducing the PKCγ:DGKγ expression ratio increases the membrane residence time of mutant γ isoform (PKCγ:DGKγ: 1:1, τPKCγ mutant = 7.2 s; PKCγ:DGKγ: 1:0.5, τPKCγ mutant = 9.1 s; PKCγ:DGKγ: 1:0.3, τPKCγ mutant = 12.1 s). (B) Translocation characteristics of PKCγ in the wild-type model. Here, results indicate that reducing the PKCγ:DGKγ expression ratio first decreases and then increases the membrane residence time of γ isoform (PKCγ:DGKγ: 1:1, τPKCγ = 18 s; PKCγ:DGKγ: 1:0.5, τPKCγ mutant = 17 s; PKCγ:DGKγ: 1:0.3, τPKCγ mutant = 19.8 s).
