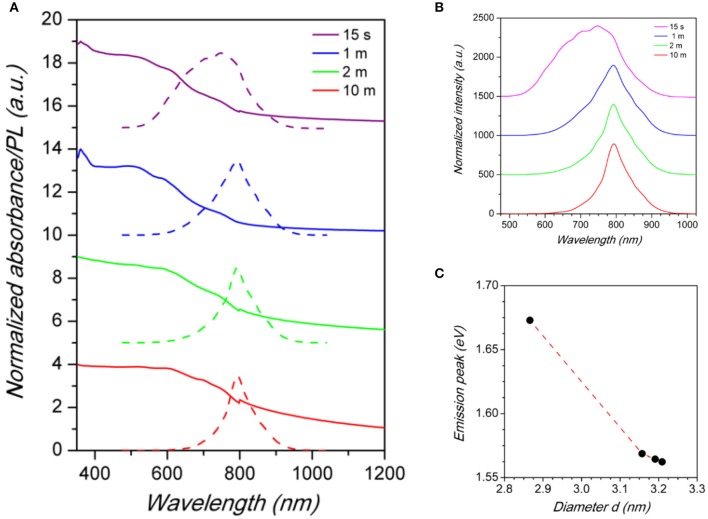
Figure 4.
(A) Absorbance (solid lines) and PL (dashed lines) spectra of Cs2SnI6 samples as a function of reaction time after Cs-oleate addition (reported in the legend). (B) Comparison between the normalized PL spectra of Cs2SnI6 for different reaction times. (C) Emission peak energy vs. Cs2SnI6 nanocrystal size. Dashed line is a guide for the eye.

