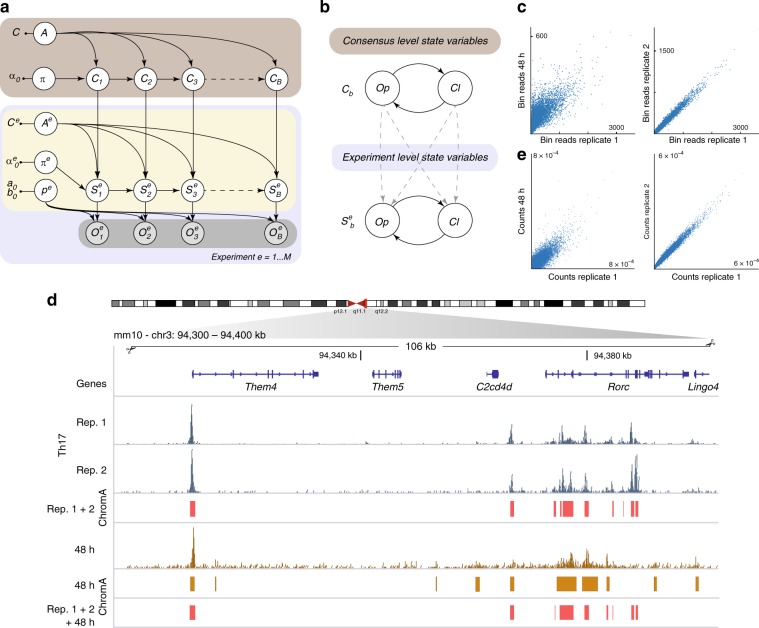
Fig. 5. Consensus ChromA integrates information from different data sets and replicates.
a Consensus ChromA probabilistic hierarchical graphical model. The model is divided into a top (light brown) and a bottom layer (light blue). The bottom layer shows ChromA’s probabilistic model for each data set analyzed (akin to Fig. 1b). The top layer schematic shows how consensus variables, C, are explicitly linked to latent-state variables for each replicate (or integrated experiment) according to Markovian dynamics. π, pg, and A variables are as in Fig. 1b. b Consensus and experiment variables C and Se evolve alternating between open, Op, and closed, Cl, states. The top and the bottom layers are linked by introducing into each experiment a dependency on the state of the consensus variable. c Raw read correlation between replicates of sorted Th17 cells’ data sets (right) and Th17 cells against CD4+ cells incubated in Th17 differentiation media for 48 h (left). d Consensus-ChromA annotations integrates information from different replicates creating and deleting accessible regions based on the context. Raw reads from sorted Th17 cells’ replicates and sorted CD4+ cells at a genomic locus. ChromA annotations for single CD4+ data set. Consensus-ChromA annotations for Th17 replicates and Th17 replicates and CD4+ cells are shown in red. e Consensus ChromA creates a common representation of chromatin accessible regions. When both Th17 replicates are combined together with CD4+ cells, the resulting consensus representation maintains the high correlation observed only when both Th17 cells’ replicates are used. CD4 + peaks are filtered, and only correlated peaks survived.

