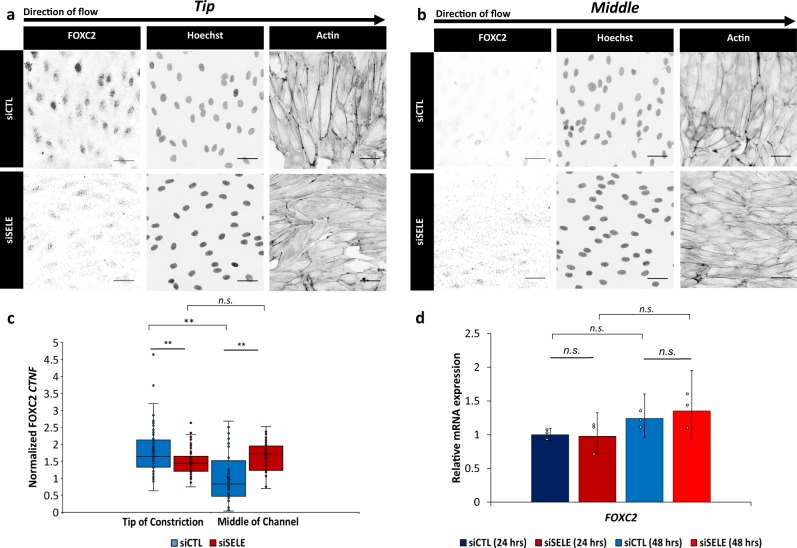
Fig. 4. FOXC2 subcellular localization is WSSG dependent.
a, b Immunofluorescence micrographs of FOXC2, Hoechst, and Actin for HLMVECs treated with scrambled siRNA (siCTL) and siRNA targeting E-selectin (siSELE) at the (a) Tip of the constriction (WSS range = 9–50 dyn cm−2) and (b) Middle of the channel (WSS = 22 dyn cm−2). HLMVECs were exposed to flow for 24 h with a maximum WSS of 50 dyn cm−2. The flow direction in each image is from left to right. Scale bar = 50 μm. c Normalized corrected nuclear fluorescence (CTNF) of FOXC2 at the Tip of the constriction and the Middle of the channel (WSS = 22 dyn cm−2) for HLMVECs treated with siCTL (blue) or siSELE (red). N = 80 cells for Tip and N = 40 cells for Middle, taken from two independent experiments. Error bars represent standard error on the mean. d Relative FOXC2 mRNA expression (referenced to scrambled siRNA control) for HLMVECs after 24 h and 48 h (blue: scrambled siRNA, siCTL; red: siRNA targeting E-selectin, siSELE), in the absence of flow. N = 7.5 × 10⁴ cells, taken from three independent experiments. Data points represent the results from independent experiments. Error bars represent the population standard deviation, propagated from the standard deviaitons of individual measurements. Solid lines above the plots indicate a pairwise comparison for significance. Asterisks indicate that the compared distributions have statistically different medians, *p < 0.05, **p < 10−3 and ***p < 10−7. n.s. not statistically significant.

