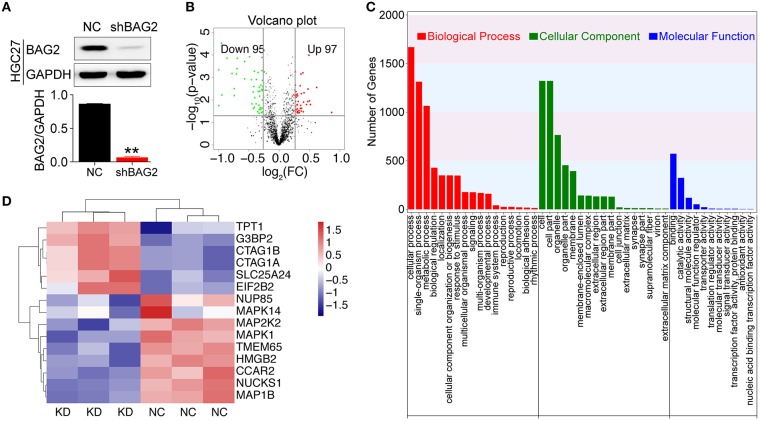
Figure 3.
Proteomic analysis after knockdown BAG2. (A) Efficiency verification of shRNA for BAG2 knockdown in the HGC27 cell line (** P < 0.01); (B) Volcanic map of DEPs showed 97 up-regulated and 95 down-regulated (when the difference multiple was more than 1.2 times or <1/1.2 times. The p-value was <0.05 by t-test, which was regarded as DEPs); (C) iTRAQ proteomic analysis of biological processes (BP), cell component (CC) and molecular function (MF) in which BAG2 may be involved; (D) Clustering map of partial BAG2-related DEPs with statistical differences.

