Figure 2.
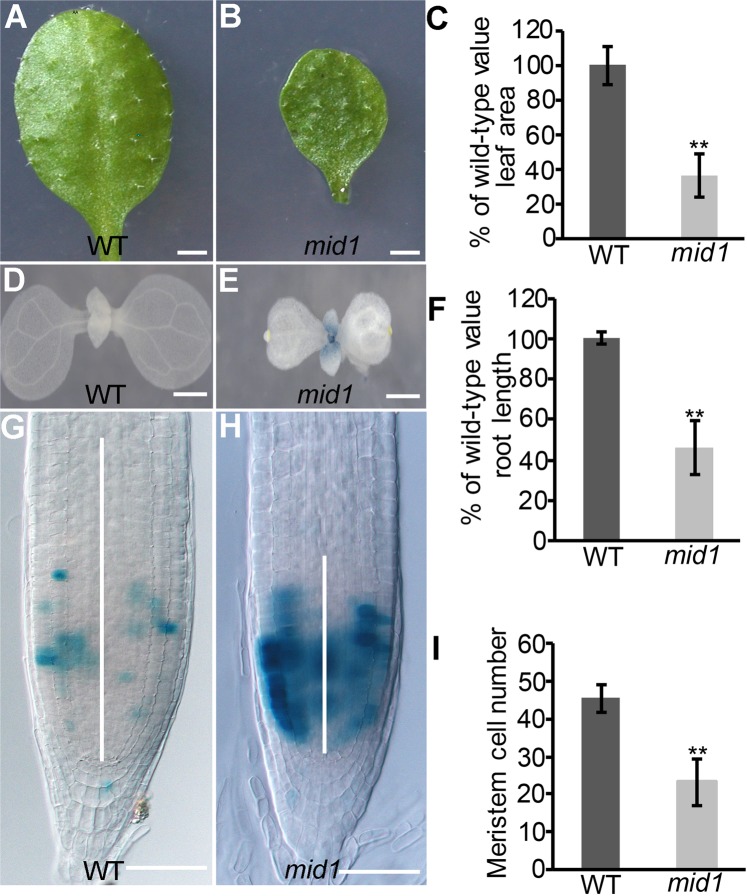
Cellular defects of mid1. (A) Fifth leaf of 4-week-old wild-type plant. Bar = 0.3 cm. (B) Fifth leaf of 4-week-old mid1 plant. Bar = 0.3 cm. (C) Leaf area measurement of wild-type and mid1. Data are the mean ± SE; n = 35. Student’s t tests were used to analyze differences between WT and mid1. Double asterisks represent highly significant differences, **P < 0.01. (D) Distribution of CYCB1;1-GUS in the 8-day-old wild-type true leaf. Bar = 1 mm. (E) Distribution of CYCB1;1-GUS in the 8-day-old mid1 true leaf. Bar = 1 mm. (F) Primary root length of 8-day-old wild-type and mid1 seedlings. Data are the mean ± SE, n = 40. Student’s t tests, **P < 0.01. (G,H) Expression of CYCB1;1-GUS in the root meristem of 8-day-old wild-type and mid1. The white lines indicate the meristem zone. Bars = 50 μm. (I) Root meristem cells number of 8-day-old wild-type and mid1 seedlings. The root meristem cells are defined by the number of cortex cells in the cortical file extending from the QC to the transition zone. Data are the mean ± SE, n = 40. Student’s t tests, **P < 0.01.

