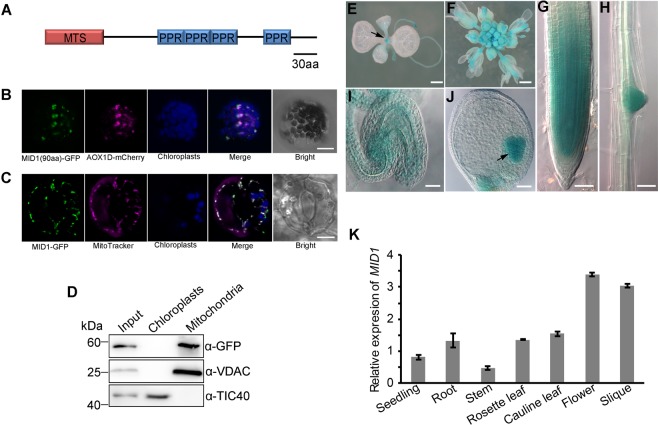
Figure 4.
The subcellular localization and expression pattern of MID1. (A) Schematic structure of MID1. MTS, mitochondrial transient signal. (B) Subcellular localization of MID1-GFP in Arabidopsis protoplasts. Bar = 10 μm. (C) Subcellular localization of MID1-GFP in the stomata of 35SPro:MID1-GFP transgenic seedling. Bar = 5 μm. (D) Immunodetection of MID1-GFP localization. α-VDAC and α-TIC40 are mitochondrion and chloroplast-specific antibodies, respectively. (E–I) The expression pattern of MID1-GUS reporter. (E) seedling, arrow indicates shoot apex, (F) flower, (G) root meristem, (H) lateral root primordium, (I) unfertilized ovule and (J) ovule with heart embryo, arrow indicate the embryo. (E,F) Bars = 1 mm, (G–J), Bars = 50 μm. (K) Relative expression levels of MID1 mRNA in diverse tissues measured by qRT-PCR. The mean data are derived from triple independent biological replicates prepared from three parallel samples, and finally normalized with ACTIN2.

