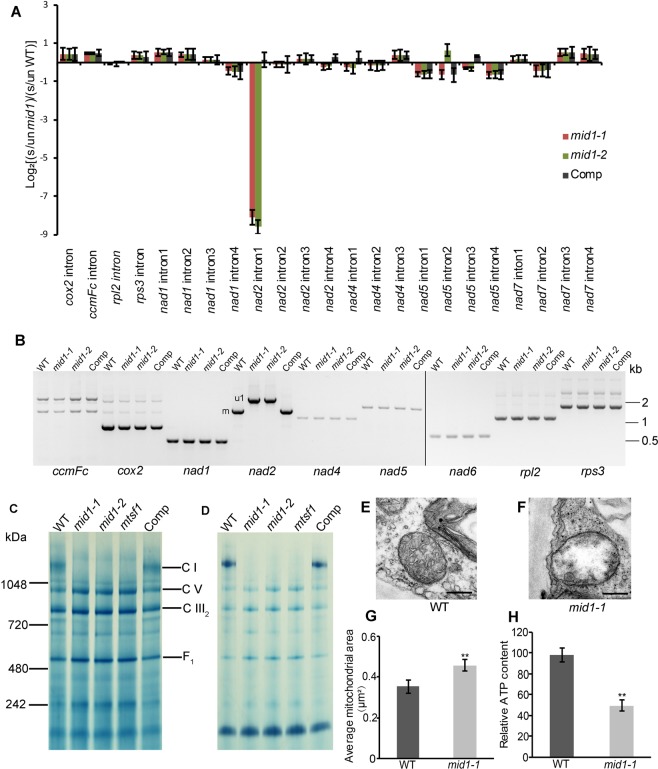
Figure 5.
Functional analysis of MID1 in mitochondria. (A) qRT-PCR analysis of splicing efficiency of mitochondrial introns in mid1. The histograms display the ratio of the spliced transcripts to the unspliced transcripts in mid1 plants as compared with wild-type in a log2 form. Each mean value is the average of three biological replicates, each of which undergoes triple repeats. s, spliced transcripts; un, unspliced transcripts. (B) RT-PCR analysis of mitochondrial transcripts splicing efficiency. u1 means nad2 transcript with intron 1.m means mature nad2 transcript. comp, MID1Pro:MID1-3 × Flag complemented line. (C) BN-PAGE analysis of mitochondrial protein complexes abundance in wild-type, mid1 mutants, mtsf-1 and complemented line. Protein marks are indicated in the left panel and the bands representing main protein complexes are listed in the right panel. (D) In-gel analysis of complex I activity in wild-type, mid1 mutants, mtsf1 and complemented line. comp, MID1Pro:MID1-3 × Flag complemented line. Transmission electron microscopy analysis of mitochondrial ultrastructure in leaf of 4-week-old WT (E) and mid1-1 (F). Bars = 0.5 μm. (G) Mitochondrial area of wild-type and mid1-1. Data are the mean ± SE, n = 140. Student’s t tests, *P < 0.05. (H) ATP content in the leaf of wild-type and mid1-1, Student’s t tests, **P < 0.01.

