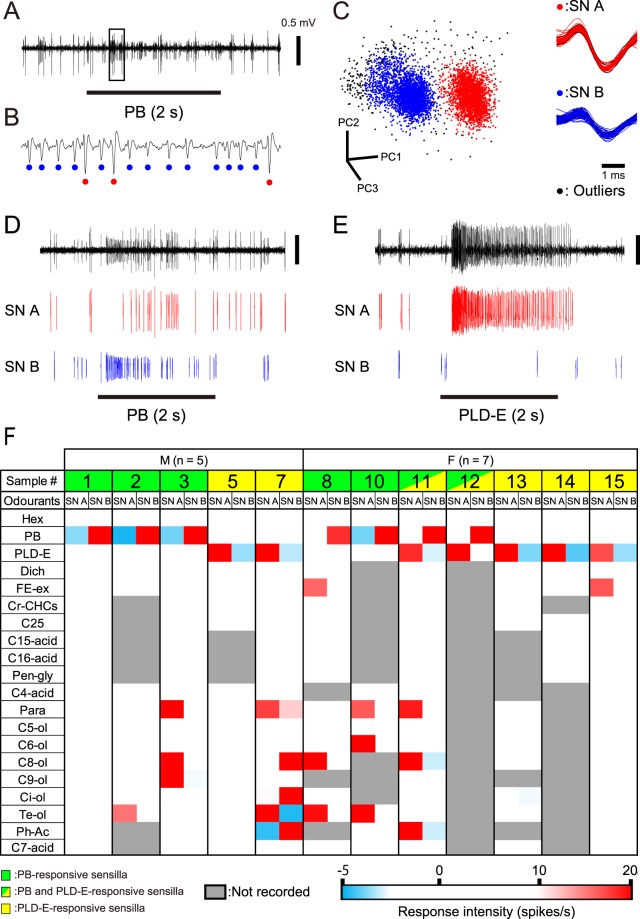
Figure 3.
Olfactory responses of OSNs in single pheromone-responsive sw-A2 sensilla. (A) The response of a sw-A2 sensillum to PB. (B) Expanded electrophysiological trace shown in A. The trace shows small-amplitude spikes (blue dots) and large-amplitude spikes (red dots). (C) Identification of two OSNs in single sw-A2 sensilla. Each of spikes is plotted based on the first three principal components (PC1-PC3) obtained from the principal component analysis using the spike amplitudes and durations (left). Cluster analysis identified two groups of spikes (red and blue dots). Outliers of the cluster analysis are shown as black dots in the 3D-space and removed from the subsequent analyses. The spike waveforms of red and blue dots are superimposed (right), and large-amplitude spikes of SN A and small-amplitude spikes of SN B are denoted by red and blue colours, respectively. (D,E) Segregated activities of SN A and SN B in PB-responsive (D) and PLD-E-responsive sw-A2 sensilla (E). (F) Olfactory responses of SN A and SN B to the tested odourants. We selected 12 pheromone-responsive sw-A2 sensilla from our SSRs (sample numbers in F and Fig. 2D) and sorted spikes of SN A and SN B. M: male, F: female.

