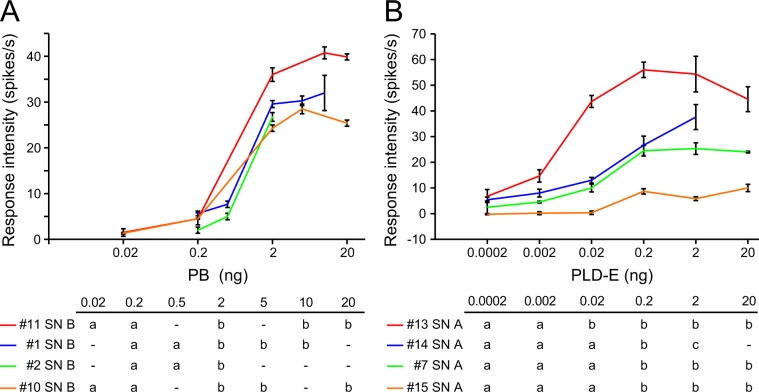
Figure 5.
Dose-response curves of PB-SNs (A) and PLD-E-SNs (B). The averaged “R−R0” values of four PB-SNs (A) and four PLD-E-SNs (B) to a given concentration of pheromones are plotted with the standard error (vertical bars). Response spectra of four PB-SNs and four PLD-E-SNs are denoted in Fig. 3F (see sample numbers). In each of recordings, response intensities to different concentrations of pheromones are compared (one-way ANOVA and post-hoc Tukey’s test), and the same alphabet letters represent no statistical significant differences (P > 0.05).

