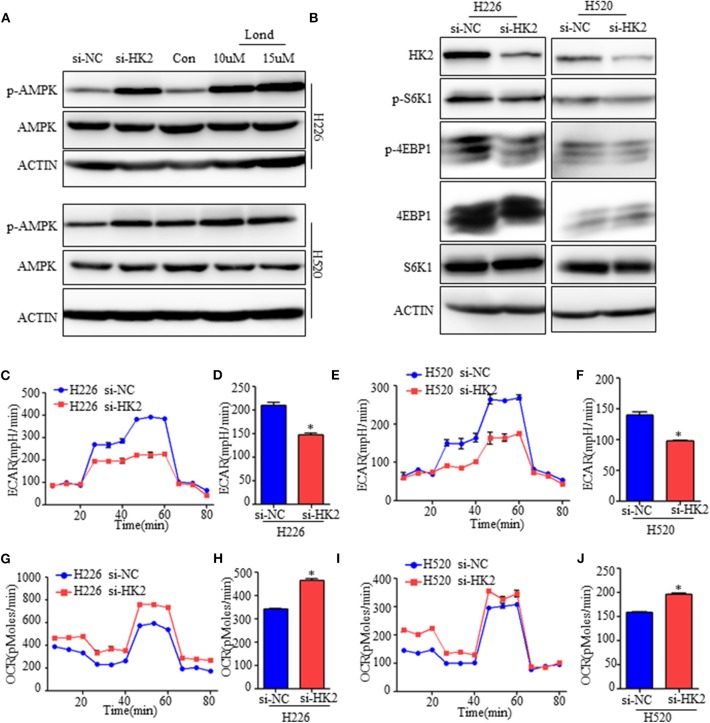
Figure 4.
Inhibiting HK2 activates AMPK and subsequently inhibits mTORC1 activity. (A) Western blot showing the expression of phospho-AMPK in H226 si-HK2- and H520 si-HK2-transfected cells compared with that in siNC-transfected cells or cells treated with different doses of lonidamine. (B) Immunoblot showing the expression of phosphor-S6K1 and phosphor-4EBP1 in H226 siHK2- and H520 si-HK2-transfected cells compared with that in H226 siNC- and H520 siNC-transfected cells, respectively. (C,D) Seahorse metabolic analysis of the extracellular acidification rate (ECAR) in H226 si-NC- and siHK226-transfected cells. (E,F) Seahorse metabolic analysis of ECAR in H520 si-NC- and siHK520-transfected cells. (G,H) Seahorse metabolic analysis of oxygen consumption rates (OCRs) in H226 si-NC- and siHK226-transfected cells. (I,J) Seahorse metabolic analysis of OCRsin H520 si-NC- and siHK520-transfected cells. *p < 0.05.

