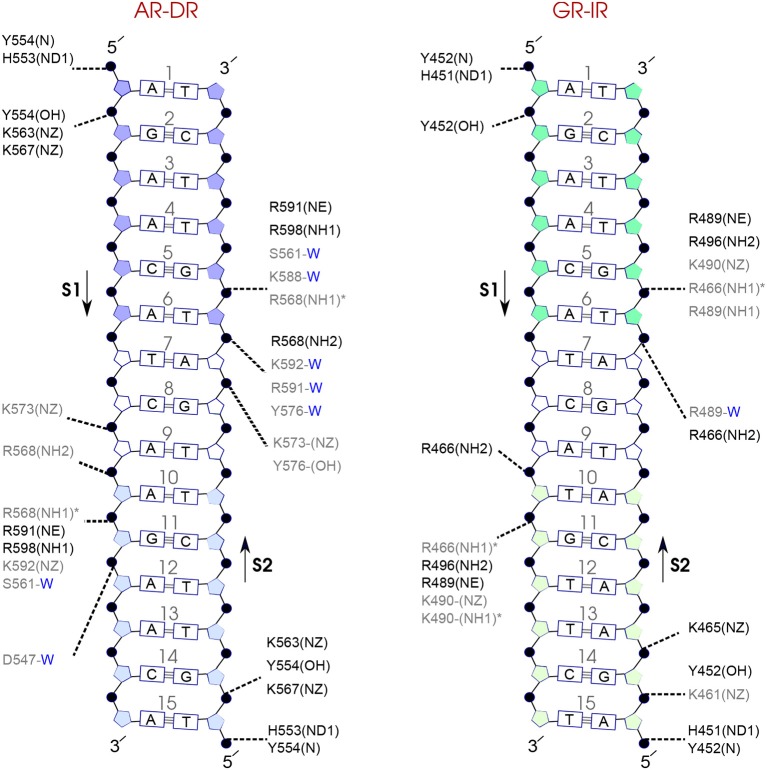
Figure 7.
Diagram of protein-DNA hydrogen-bond interactions for (left) AR-DR and (right) GR-IR. The nucleotides of the 15 bps core DNA sequence are numbered from HS1 (numbers: 1–6) to HS2 (numbers: 10–15). The spacer region is highlighted with non-colored boxes around the numbers of the bases (numbers: 7–9). The hydrogen bonds are categorized based on their occupancy, 50–75% (gray), and 75–100% (black). The water mediated hydrogen bonds are shown with a blue letter “W.” The residues shown with star sign form base-specific hydrogen-bond interactions while the other residues interact with the backbone of the DNA.

