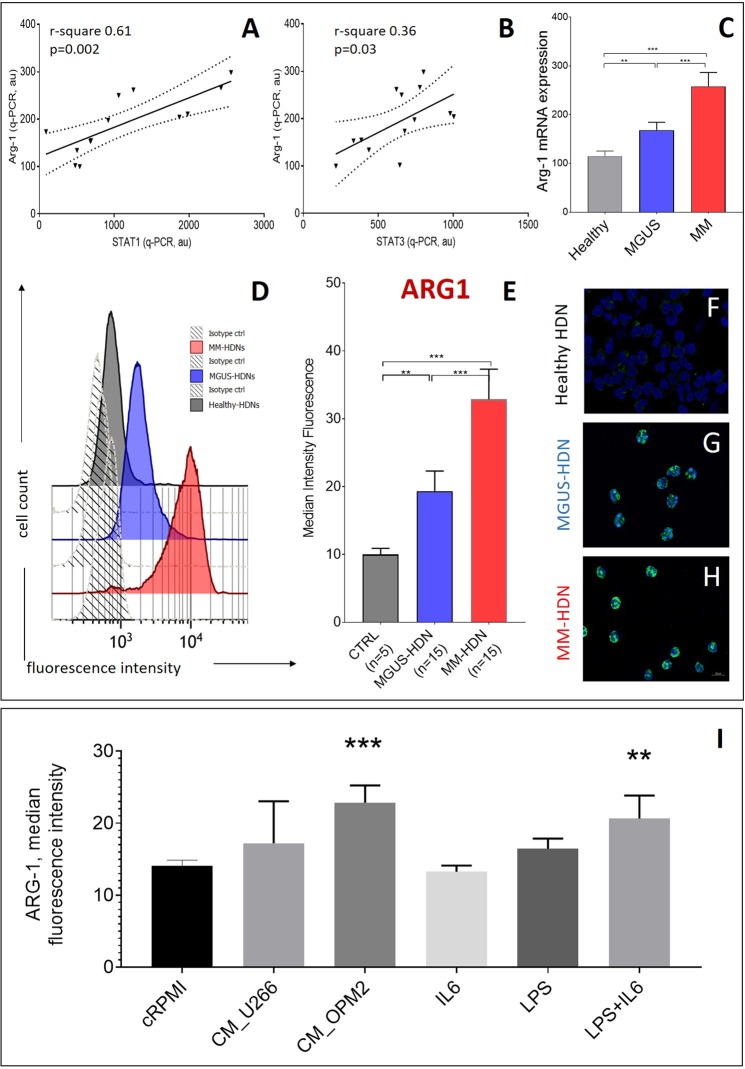
Figure 4.
Arginase-1, target of activated STAT3, is increased in MM and MGUS high-density neutrophils. The association between the quantity of ARG1 transcript in MM and MGUS high-density neutrophils with STAT1 (A) and STAT3 (B) transcripts is shown. Dot-lines represent interval of confidence. (C) Arginase expression in healthy, MGUS and MM high-density neutrophils, as detected by qRT-PCR is shown; the differences were evaluated according to ANOVA test. In an independent set of HDNs at steady state, as obtained from peripheral blood of MM, MGUS and healthy subjects, median intensity of fluorescence (MFI) of ARG1 was detected by flow cytometry(D-E). (F-H) ARG1 immunofluorescence staining in HDN isolated by immune-magnetic-based positive selection after density gradient sedimentation from healthy, MGUS and MM subjects. ARG-1 localized in cytosol, in grains larger in MM-HDN than in controls. (I) After exposure of healthy HDNs to MM conditioned media obtained from two human myeloma cell lines U266 and OPM2 or 20 ng/mL IL6 or 100 ng/mL LPS for 24 hours, ARG1 was measured by flow cytometry. For more robust statistical evaluation, MFI values were converted to a resolution metric, such as the RD defined as (Mediantreatment-Mediancontrol)/(rSDtreatment + rSDcontrol) to further perform t-test to compare results of different experiments and runs. Stars denote p-value (***p < 0.0001) using t-test.

