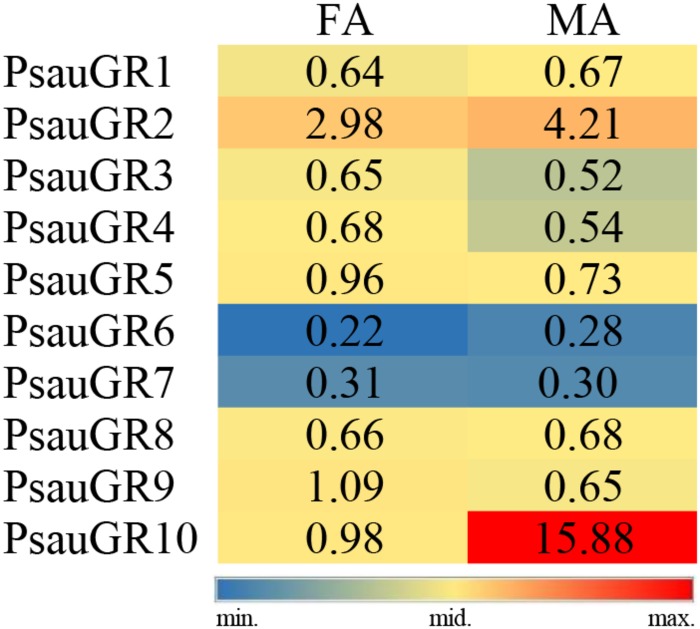
FIGURE 7.
Heat-plot of FPKM values for PsauGRs in female antennae (FA) and male antennae (MA). In each box, the FPKM value of each PsauGR gene is indicated. Color scales were established for PsauGRs using the conditional formatting option in Excel (red: max. value, yellow: mid. value, and blue: min. value).

