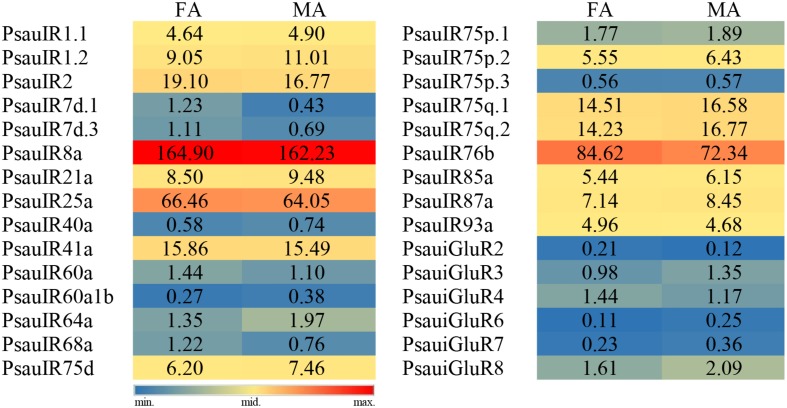
FIGURE 9.
Heat-plot of FPKM values for PsauIRs/iGluRs in female antennae (FA) and male antennae (MA). In each box, the FPKM value of each PsauIR/iGluR gene is indicated. Color scales were established for PsauIRs/iGluRs using the conditional formatting option in Excel (red: max. value, yellow: mid. value, and blue: min. value).

