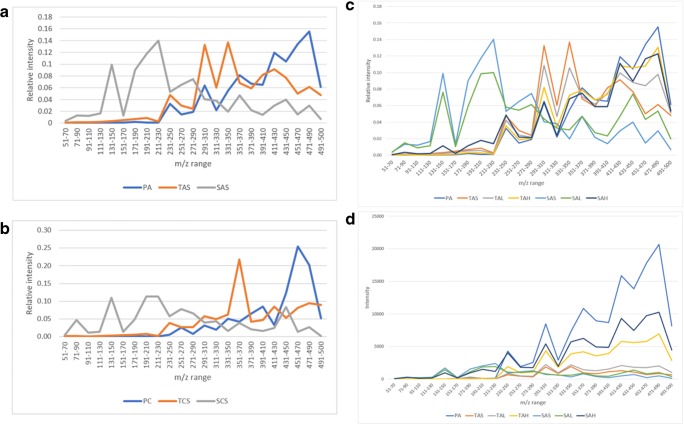
Fig. 3.
Relative signal ratios per m/z range for a product A (lower average MW), b product C (higher average MW), and c product A including spiked samples; d absolute signal ratios per m/z range of product A including spiked samples. M/z comparisons are not the same as molecular weight comparisons, but in general, the m/z value increases with increasing mass and below m/z 500 singly charged ions are abundant. The sample codes are explained in the Materials and methods section

