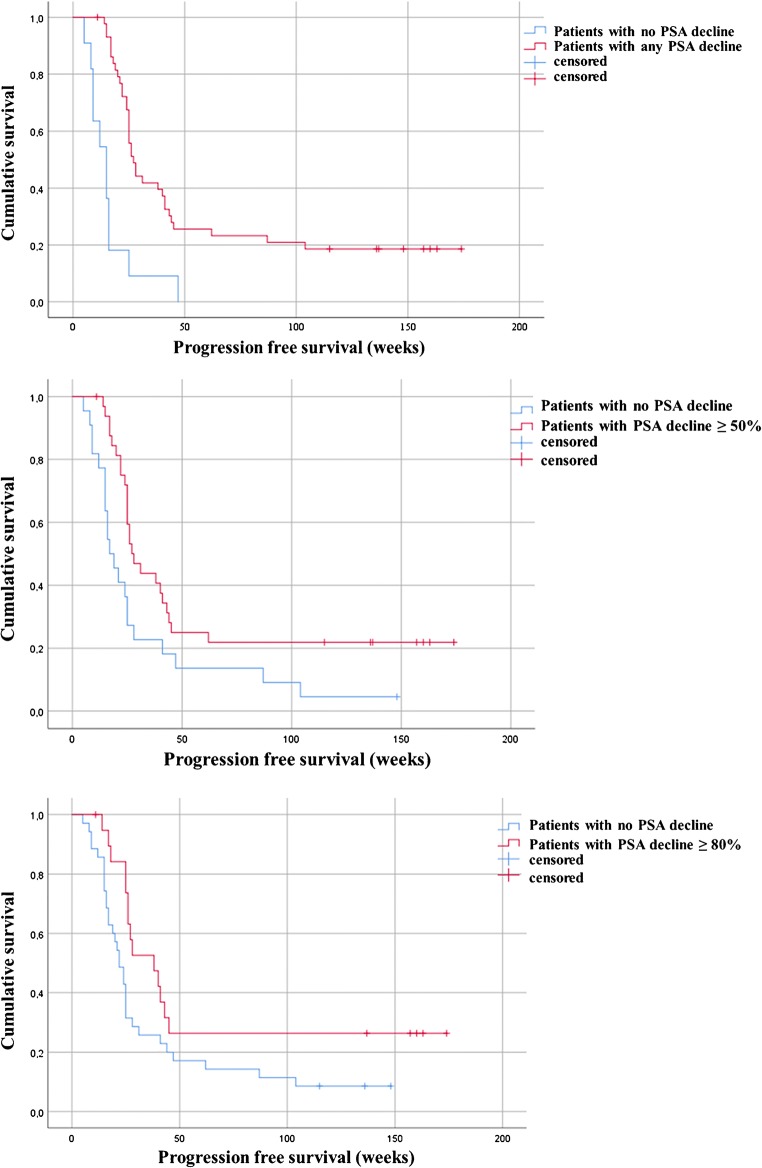
Fig. 2.
Kaplan-Meier plot shows progression free survival of the patients stratified by PSA response. Patients with any PSA reduction revealed significantly longer PFS than patients with no PSA decline (27 vs. 15 weeks, P < 0.0001). Patients with a PSA reduction of ≥ 80% had significantly longer PFS than patients with no PSA reduction (38 vs. 22 weeks, P = 0.03)

