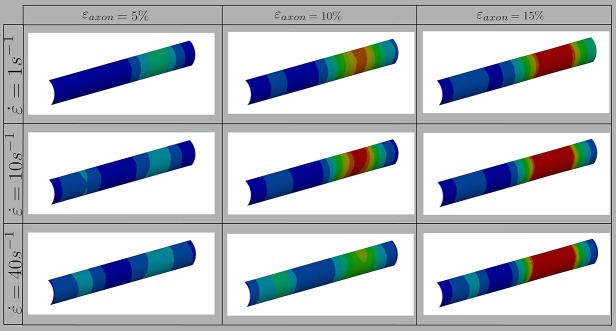
Figure 3.
Fringe plots showing the 1st Principal Green-Lagrange strain along the axonal cortex as a result of 5, 10, and 15% axonal strains in the first, second and third column, respectively. In the first, second and third row results for strain rates of 1, 10, and 40/s are reported. The range was set between 0 and 40% for visualization purposes.

