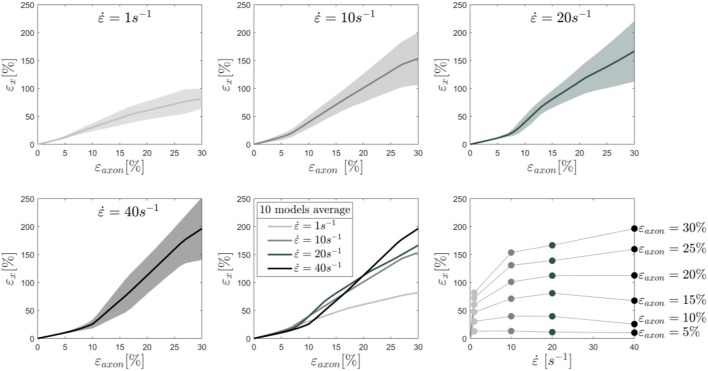
Figure 4.
Maximum 1st Principal Green-Lagrange strains in the axonal corex as a function of axonal strain. Lines represent the average over 10 models and the shaded areas represent the standard deviations. Results are shown for strain rates 1,10, 20, and 40/s. In the second row (center), the means for the different strain rates are shown in the same plot to ease the visual comparison. Finally, in the second row (right), iso-strain curves are reported, which show the maximum 1st Principal Green-Lagrange strains in the cortex as a function of the applied strain rate.

