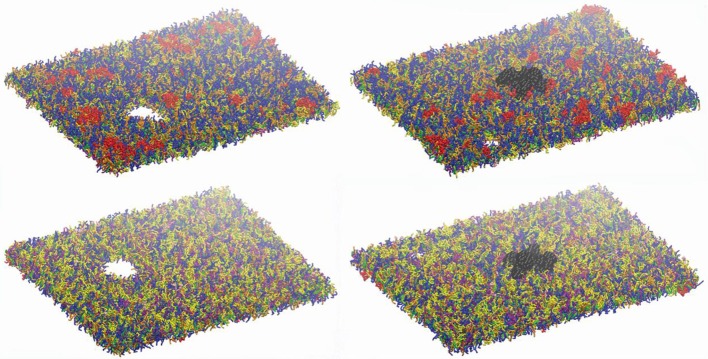
Figure 7.
Lipid bilayers disruption. Left panels: snapshot at 680 ns at εx= 0.34 in absence of Nav1.1. Right panels: snapshot at 27 ns for εx = 0.47 in presence of Nav1.1. (in black). Top panels show the upper leaflets, low panels show the lower leaflets. For lipids color code, see Figure 1.

