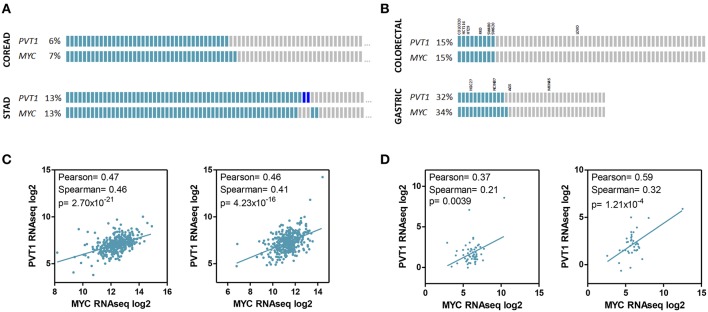
Figure 3.
PVT1 and MYC expression in gastrointestinal tumors and cell lines. PVT1 and MYC copy number variation (A,B) and RNAseq expression (C,D) in tumor samples from colorectal (n = 616) and stomach (n = 441) adenocarcinomas (A,C) and established cell lines from colorectal (n = 58) and gastric tumors (n = 38) (B,D). The name of cell lines used in studies investigating the role of PVT1 in gastrointestinal cancer are shown. Gray boxes indicate no alteration. Light blue boxes indicate gene amplification. Dark blue boxes indicate gene deletion. RNAseq expression units: RPKM (Reads Per Kilobase Million). Pearson and Spearman correlation coefficients and associated p-value (Spearman) are shown.

