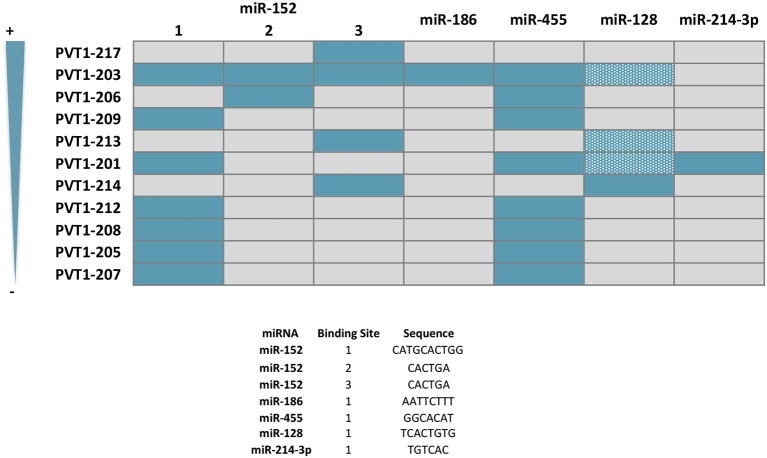
Figure 6.
Predicted sponge capacity of miRNAs by PVT1 transcript variants. PTV1 isoforms are ranked according to their relative expression abundance (%) in gastrointestinal normal tissues and tumors. Gray and solid blue boxes indicate absence and presence of the nucleotide sequence complementary to the different miRNA, respectively. Patterned blue boxes indicate complementarity with miR-128 principal binding motif, but lack of the additional contact sites and/or difference in length from the main interacting core. Nucleotide sequence of the miRNA binding site is specified.

