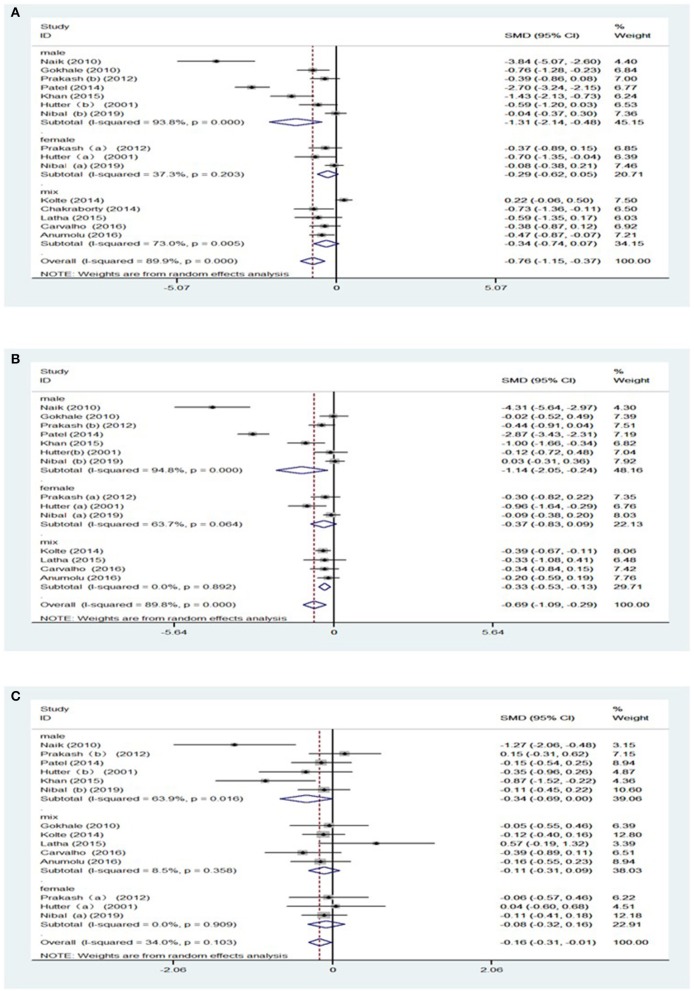
Figure 2.
Forest plot of the studies regarding gender. (A) Forest plot of the studies regarding association between Hb and gender; (B) Forest plot of the studies regarding association between RBC counts and gender.; (C) Forest plot of the studies regarding association between MCV and gender. SMD, standardized mean difference; CI, confidence intervals; (a) means of female participants in the studies, (b) means of male participants in studies.

