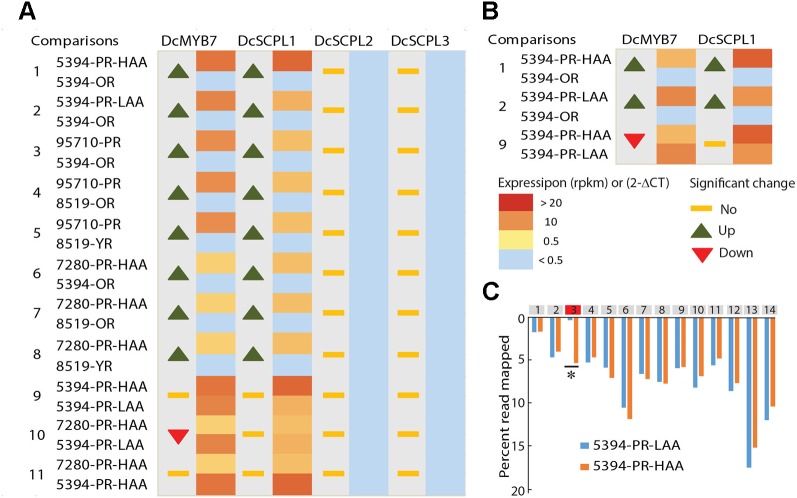
Figure 4.
Comparative transcriptome analysis of candidate genes potentially involved in anthocyanin acylation of carrot roots. (A) RNA-Seq data from seven different carrot root tissues and across 11 comparisons ( Supplementary Tables S6 – S7 ). The heatmaps represent the expression level from yellow (< 0.5 RPKM) to red (> 20 RPKM). Samples with a normalized read level <0.5 RPKM, were considered non-expressed and are labeled in blue. For each comparison, statistically significant fold changes (Log FC) in expression between tissues are indicated by an up or down arrow. (B) RT-qPCR results in 5394 root tissues, from three biological replicates. Heatmaps represent the relative expression of DcSCPL1 and DcMYB7 using the 2-ΔCT method. For each comparison, statistically significant fold changes through ANOVA analysis (P < 0.01) are indicated by an up or down arrow. (C) Distribution of the reads mapping to each exon of DcSCPL1, in 5394-PR-HAA and 5394-PR-LAA plants. All exons are represented by gray boxes except exon-3 that is represented in red. The quantification of the reads mapping each exon is expressed in percentage of the total number of reads mapping DcSCPL1. Statistically different expression of each exon (*) between HAA and LAA plants were tested using a negative binomial test with RPKM value (Log2FC > 1 and FDR ≤ 0.5). The statistical results of each exon are presented in Supplementary Table S12 .

