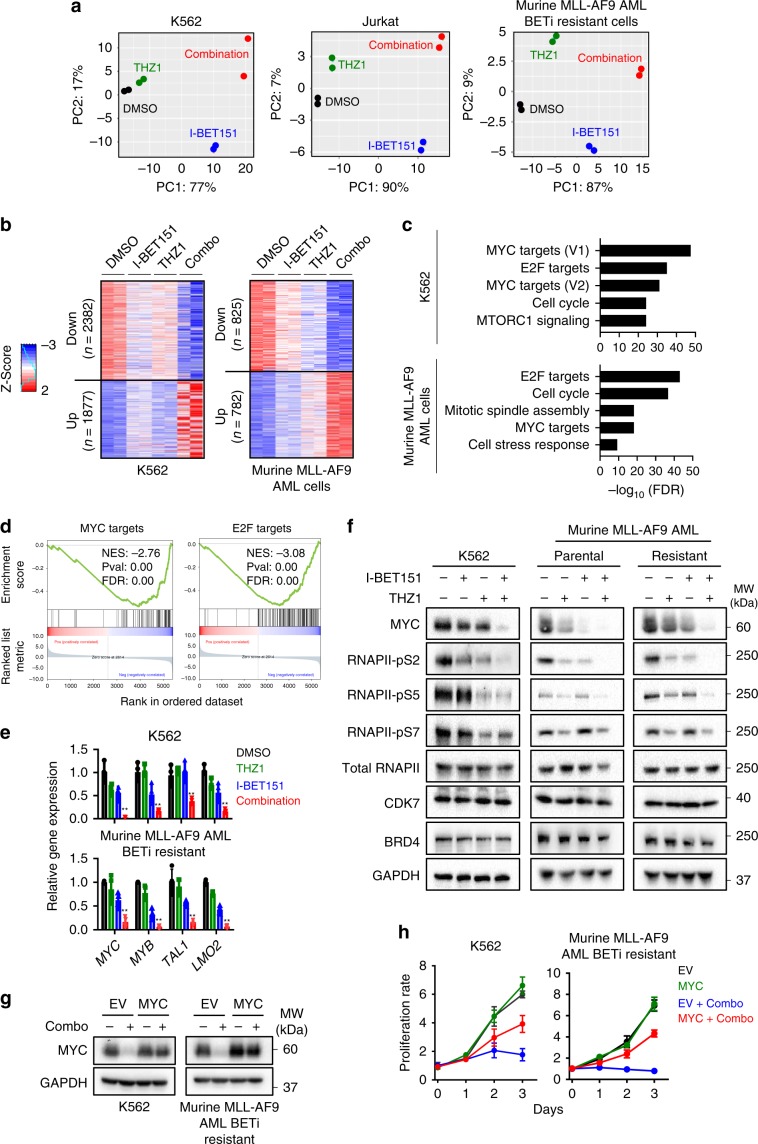
Fig. 4. MYC identified as a critical target that mediates the synergistic lethality of I-BET151 and THZ1 in BETi-resistant leukemia cells.
a The PCA analysis of RNA-seq results in K562, Jurkat and BETi-resistant murine AF9 AML cells treated with DMSO (black), I-BET151 (blue), THZ1 (green), and the combination of I-BET151 + THZ1 (red) for 24 h. b Heatmap representation of differentially expressed genes (DEGs) identified between the DMSO, I-BET151, THZ1, and the combination treatment in K562 and murine AF9 BETi-resistant AML cells. DEGs were defined as q-value < = 0.05. Red and blue color stand for up- and down-regulated genes, respectively. (c) Gene Set Enrichment Analysis (GSEA) of DEGs identified from Fig. 4b. d GSEA presentation of MYC or E2F targeted genes in the identified DEGs. Genes were ranked by fold changes. e Real-time qPCR analysis of super-enhancer related genes in K562 and murine BETi-resistant AF9 AML cells after DMSO (black), I-BET151 (blue), THZ1 (green), and the combination treatment (red) for 24 h. Data were shown as mean ± S.D; n = 4 from four independent assays. **P = 0.002 (MYC), 0.0015 (MYB), 0.01 (MEIS1) and 0.0006 (LMO2), by two-tailed Student’s t test. f Representative Western blotting showing the protein levels of MYC, CDK7, BRD4, phosphorylated and total RNAPII in K562, murine BETi-sensitive or resistant AF9 AML cells after DMSO, I-BET151, THZ1, and the combination treatment for 24 h. GAPDH was used as control. n = 3 from 3 independent assays. g Immunoblot analysis of MYC expression in K562 and BETi-resistant murine AF9 AML cells transduced with the empty vector (EV) or a lentivirus encoding MYC. Cells were treated with DMSO or combination (Combo) for 24 h. Three independent assays were performed. h Proliferation rate of K562 and BETi-resistant murine AF9 AML cells expressing the empty vector (EV) or MYC after DMSO or the combination treatment (Combo) for 3 days. Data were shown as mean ± S.D; n = 8 from 4 independent assays. Drug concentrations used in Fig. 4 were the same as in Fig. 2b, c for each cell line.

