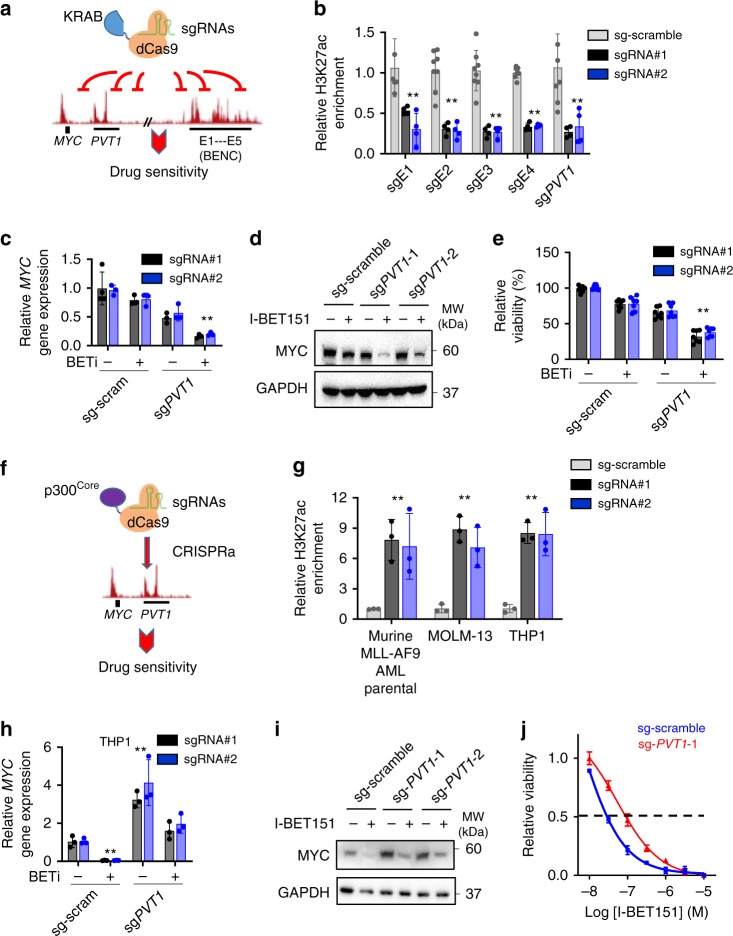
Fig. 6. PVT1 enhancer positively regulates MYC expression in BETi-resistant leukemia cells.
a Schematic depicting the use of dCas9-KRAB-based CRISRPi to target MYC-associated PVT1 or BENC enhancers. b ChIP-qPCR analysis of H3K27ac enrichment in K562 cells transduced with a scrambled sgRNA or sgRNA targeted to the PVT1 and BENC loci. Data were shown as mean ± S.D; n = 4 from four independent assays, **P = 0.01 (E1), 0.0007 (E2), 0.0006 (E3), 0.0001 (E4), and 0.01 (PVT1), by two-tailed Student’s t test. c–e Transcription (c), protein (d) levels and cell viability (e) of K562 cells expressing dCas9-KRAB and two independent sgRNAs targeted to PVT1 after BETi treatment. K562 cells transduced with dCas9-KRAB and scrambled sgRNAs were used as control. Data were shown as mean ± S.D; n = 3 from three independent assays, **P = 0.0002 (c) and 0.0004 (e), by two-tailed Student’s t test. f Schematics depicting the use of the dCas9-p300Core-based CRISRPa system to target MYC-associated PVT1 enhancers. g ChIP-qPCR analysis of H3K27ac enrichment in THP1, MOLM-13 and murine MLL-AF9 parental cells transduced with a scrambled sgRNA or sgRNA targeted to the PVT1 locus. Data were shown as mean ± S.D; n = 3 from three independent assays, **P = 0.028 (AF9), 0.012 (MOLM-13) and 0.011 (THP1) by two-tailed Student’s t test. h–j Comparison of gene transcription (h), protein expression (i) levels and dose response curves (j) of THP1 cells expressing dCas9-p300Core and two independent sgRNAs targeted to PVT1 after BETi treatment. THP1 cells transduced with dCas9-p300Core and scrambled sgRNAs were used as control. Data were shown as mean ± S.D; n = 3 from three independent assays, **P = 0.0001 (sg-scram) and 0.0005 (sg-PVT1), by two-tailed Student’s t test.

