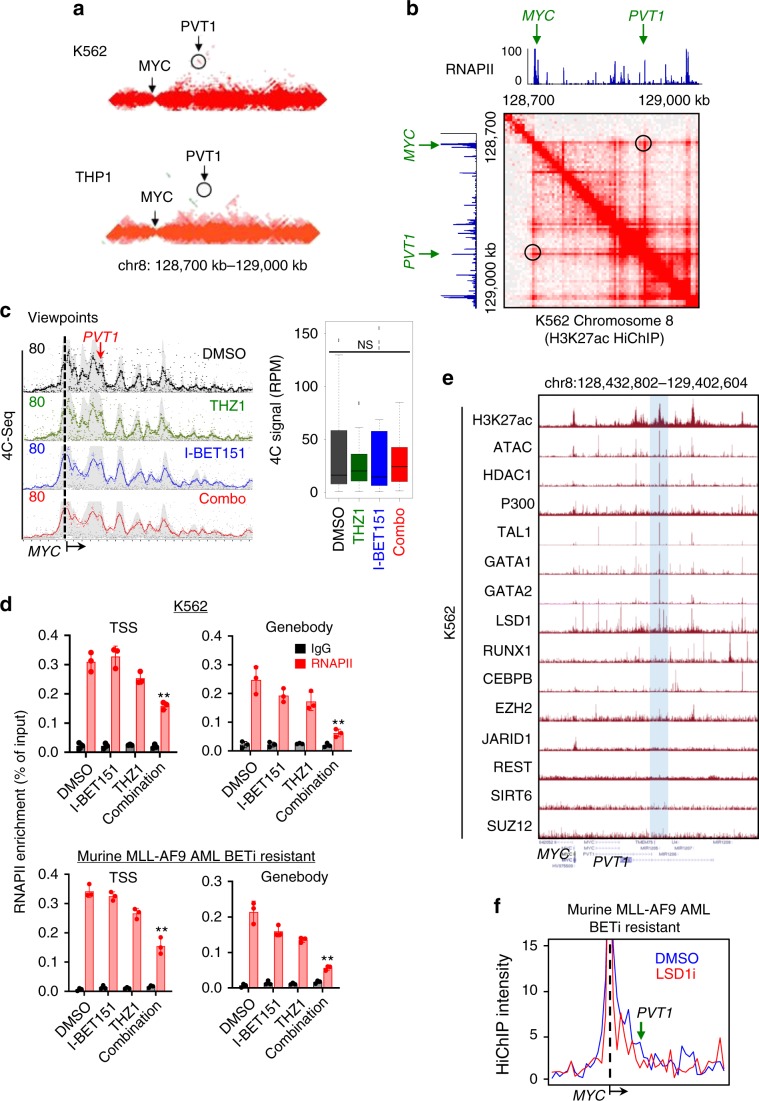
Fig. 7. THZ1 inhibits MYC transcription by disrupting RNAPII loading at a BETi-resistant specific enhancer-promoter loop in BETi-resistant leukemia cells.
a Heatmap showing HiC signals for the K562 (top) and THP1 (bottom) cell lines at the MYC locus (arrow) with flanking regions (chr8: 128,700–129,000 kb). Circled region indicated the PVT1 enhancer. b Genome browser views of H3K27ac HiChIP and RNAPII ChIP-seq signals within the MYC and PVT1 loci. The heatmaps were generated using Juicebox. Circled regions indicated the PTV1 enhancer. c 4C-seq of K562 cells treated with DMSO (black), THZ1 (green), I-BET151 (blue), and a combination of THZ1 and I-BET151 (red) for 24 h. Viewpoints were selected at the MYC promoter. Red arrow indicated the PVT1 locus (left). The normalized 4C reads per fragment at the PVT1 locus were shown as boxplots (right). n = 3 biological samples; NS: Not significant, by One-way ANOVA with Dunnett’s post hoc correction.For the boxplots, bounds of the box spans from 25 to 75% percentile, center line within box represents median. Whiskers represent median ± 1.5 times interquartile range. Dots represent outliers. d ChIP-qPCR analysis of RNAPII enrichment (red) at transcription starting site (TSS) and genebody of MYC in K562 cells treated with DMSO, THZ1, I-BET151, and a combination of THZ1 and I-BET151 for 24 h. Chromatin pulled down with IgG was used as control (black). Data were shown as mean ± S.D; n = 3 from 3 independent assays. **P = 0.014 and 0.026 (K562, TSS and gene body); p = 0.01 and 0.007 (AF9, TSS and gene body), by two-tailed Student’s t test. Drug concentrations used in Fig. 6c, d were the same as in Fig. 2b, c for each cell line. e Genome browser views showing the enrichment of different transcription factors (TFs) at the PVT1 locus. Hi-C, H3K27ac HiChIP and ChIP-seq data of the corresponding TFs and RNAPII were obtained from publicly available data listed in Supplementary Table 1. f H3K27ac HiChIP intensities at the PVT1 and MYC loci in BETi-resistant murine MLL-AF9 AML cells treated with DMSO (blue) or LSD1i (red).

