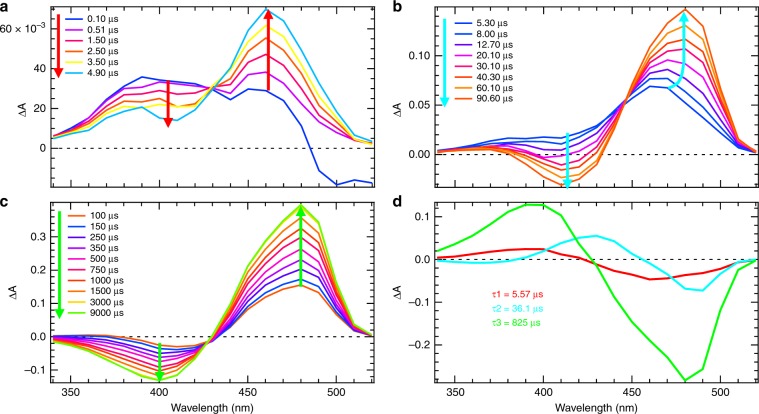
Fig. 2. Transient UV–Visible spectroscopy in H2O solution.
Time-resolved difference absorption spectra of rsEGFP2 in H2O solution (50 mM HEPES pH 8, 50 mM NaCl) recorded after a 410 nm nanosecond excitation of the trans-protonated off-state in the time windows from 100 ns to 9 ms (a–c). The spectrum without laser excitation was subtracted to calculate the difference spectra. The colored arrows (red in (a), cyan in (b) and light green in (c)) correspond to the three time constants (5.57, 36.1 and 825 µs, respectively) identified by a global fit analysis of kinetic traces for all wavelengths. d Decay associated spectra obtained by fitting the kinetic traces in panels (a–c) for all wavelengths with a weighted sum of three exponential functions.

