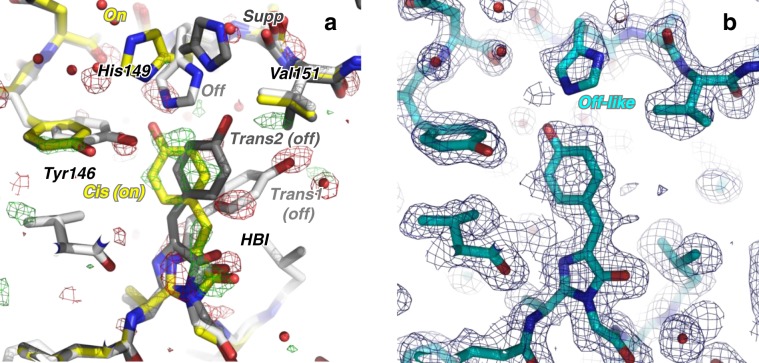
Fig. 4. 10-ns intermediate-state structure.
a Q-weighted difference electron density map (Fobslaser_on_∆10ns–Fobslaser_off), determined from SFX data with and without pump-laser activation, is contoured at +3σ (green) and −3σ (red) and overlaid onto the model determined from the laser_off dataset. b Model of the laser_on_∆10 ns intermediate structure (cyan) determined by difference refinement at 1.85 Å resolution. 2Fextrapolatedlaser_on_∆10ns–Fcalc (blue, 1σ) and Fextrapolatedlaser_on_∆10ns–Fcalc maps (green/red, ±3σ, respectively) are shown.

