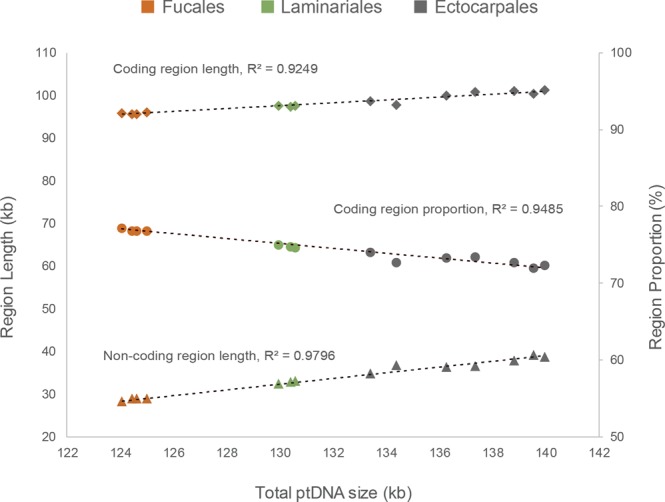
Figure 1.

Total length of non-coding DNA sequences regressed on plastid genome size. There was a strong correlation (R2 = 0.9796) between the amount of non-coding DNA sequence and whole plastid genome size for the 12 brown algae. The dashed line indicates the linear regression representing the correlation. Data points for the Fucales (brown) and Laminariales (green) species are positioned closely together but data points for the Ectocarpales species (grey dots) are widely scattered.
